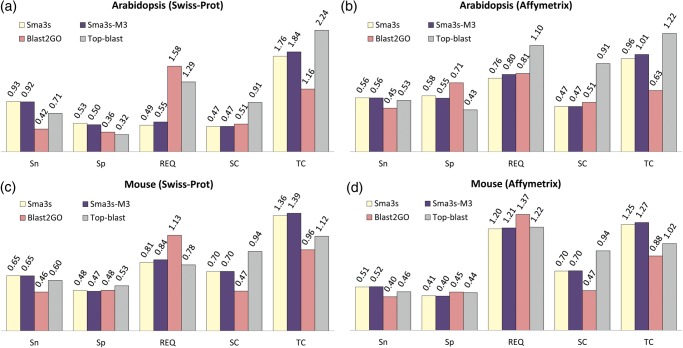
Figure 5.
Annotation of two DNA arrays using Sma3s, Blast2GO and Top-BLAST. The annotation prediction results of mouse and Arabidopsis sequences are shown from Sma3s with all modules, Sma3s with the M3 module only, Blast2GO and Top-BLAST. The corresponding values appear above the bars. Sn, sensitivity; Sp, specificity; SC, sequence coverage; TC, term coverage. This figure appears in colour in the online version of DNA Research.

