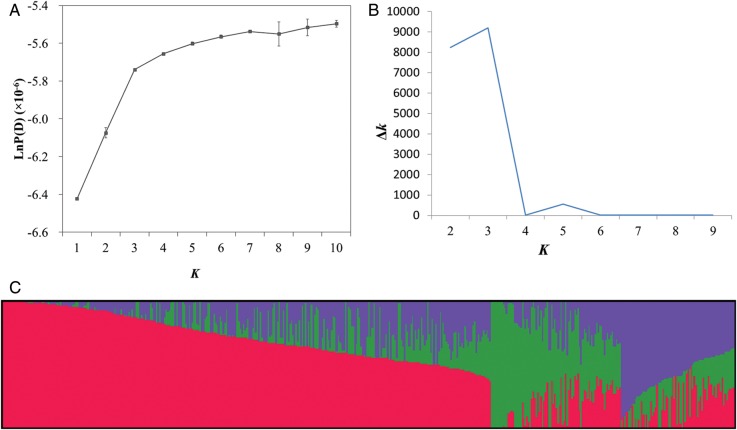
Figure 1.
Analysis of the population structure of 472 rapeseed accessions by STRUCTURE. (a) Estimated LnP(D) of possible clusters (k) from 1 to 10; (b) Δk based on the rate of change of LnP(D) between successive k; (c) population structure based on k = 3. Each individual is represented by a vertical bar, partitioned into coloured segments with the length of each segment representing the proportion of the individual's genome. A given group is represented: Red, Group 1; Green, Group 2; Purple, Group 3.

