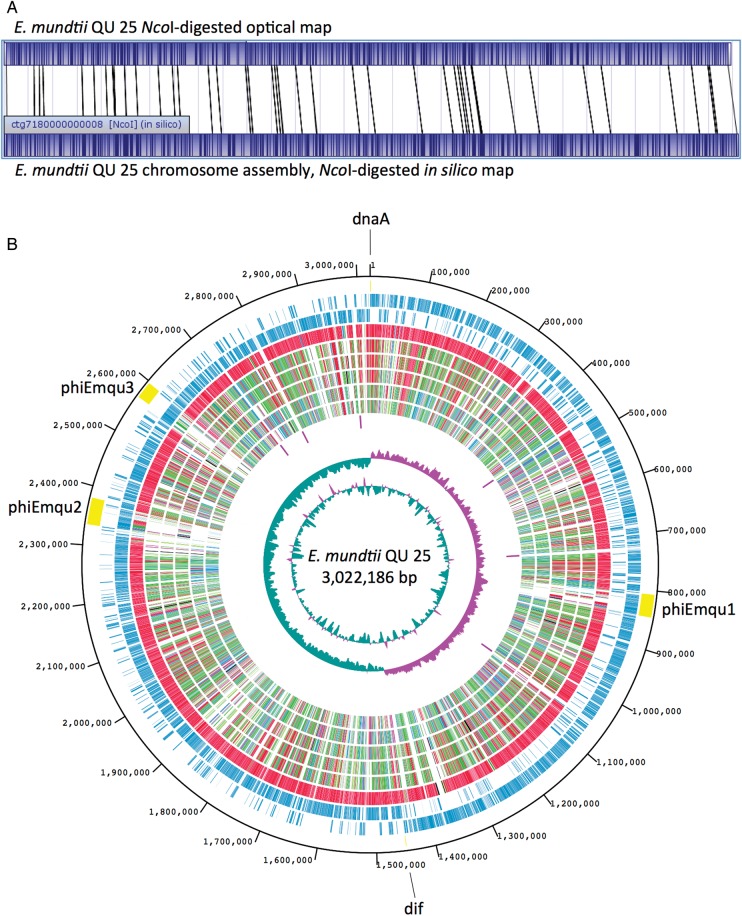
Figure 1.
Analysis of the Enterococcus mundtii QU 25 complete genome. (A) Linearized NcoI-digested whole-genome optical map of QU 25 compared with the in silico-derived NcoI-digest map, demonstrating correct chromosome assembly. (B) Genome map of the QU 25 strain. In the outermost circle, three prophages of phiEmqu1, phiEmqu2, and phiEmqu3, replication origin (dnaA), and terminus (dif) are shown. In the second circle, the ORFs transcribed in a clockwise manner are shown as bars. The third circle shows ORFS transcribed in a counter-clockwise manner. The fourth to ninth circles depict the results of ortholog analyses (BLASTP E-value ≤1 × 10⁻¹⁰) with E. mundtii ATCC 882, E. faecium DO, E. faecium Aus0004, E. hirae ATCC 9790, E. casseliflavus EC20, and E. faecalis V583, respectively. The extent of homology relative to QU 25 is depicted using a heat map of arbitrarily chosen bins. The colour scheme and percentage identity for orthologs are as follows: red, orthologs with >90% identity; green, 70–90% identity; blue, 50–70% identity; and black, <50% identity. The 10th circle shows the positions of rRNA operons. The last two (innermost) circles represent G + C content (purple >39.5% average; green <39.5% average; range from 32 to 47%) and G + C skew, both calculated for a 10-kb window with 1-kb stepping.

