
Figure 7.
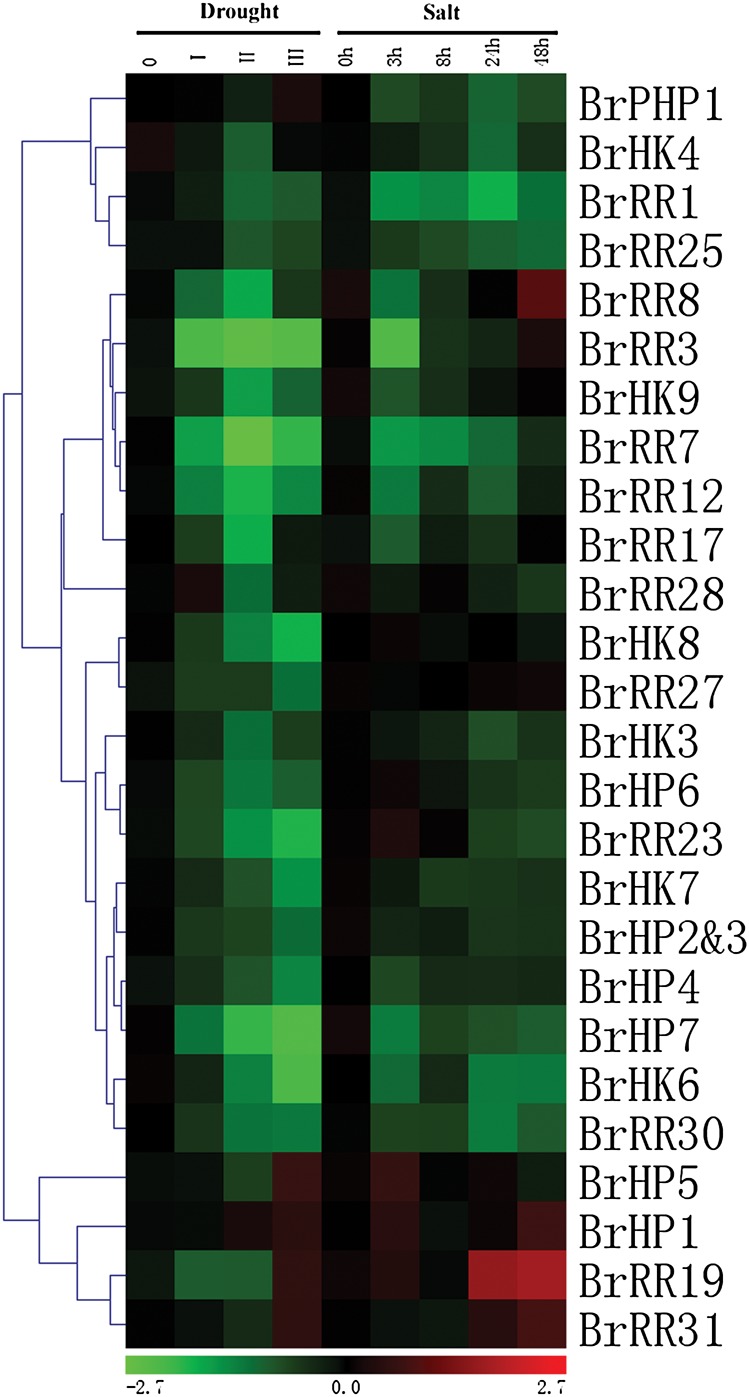
Hierarchical clustering and heat map representation for the response patterns to drought and high salinity conditions of TCS genes in Chinese cabbage roots. The expression levels of genes are presented using fold-change values transformed to Log2 format compared with control. This figure appears in colour in the online version of DNA Research.