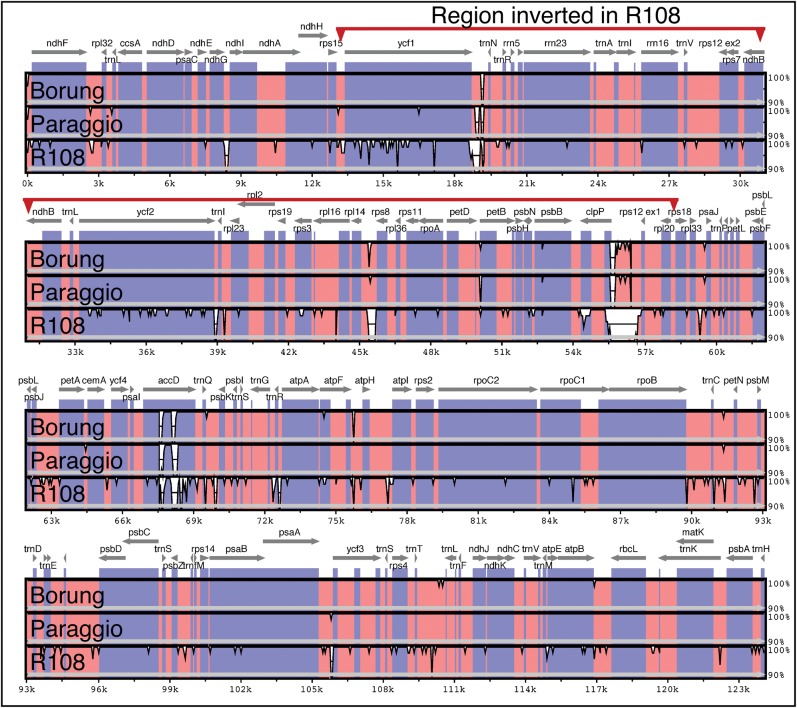
Figure 2.
mVISTA similarity plot comparing the reference Jemalong 2HA ptDNA with the Borung, Paraggio and R108 ptDNAs. For the purpose of this figure, the R108 inversion was manually reversed. The sliding window is set to 50 bp, the consensus width to 50 bp and the consensus identity to 70%. Coding regions are in blue, and non-coding regions are in pink.

