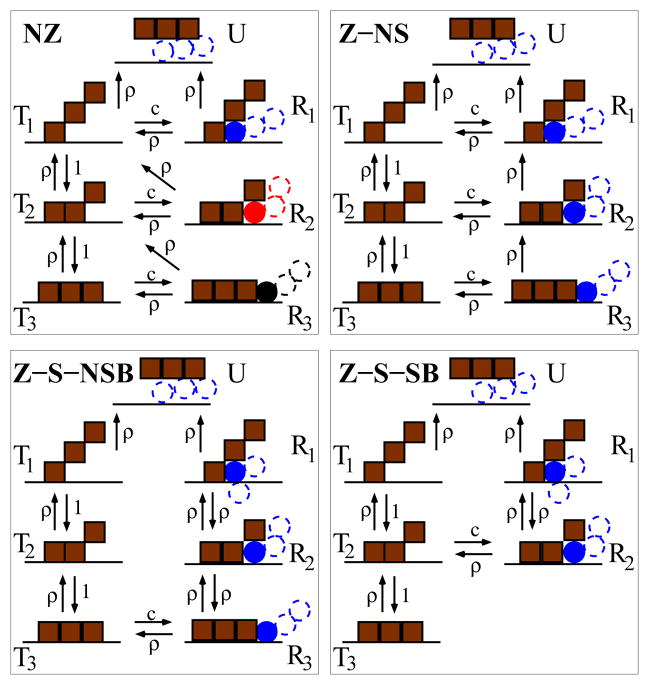
FIG. 1.
The four proposed unbinding pathways. Brown squares show N (=3 here) units of a protein bound to DNA (dark horizontal line). Circles show units of the invader proteins, with different colors corresponding to different proteins. Filled circles show units occupying the zipping site. The most likely replacement scenario at small concentration is shown with the blue invader protein. Parameters entering the rates are: (i) the mean number c of solution-phase proteins per binding site, in units of the elementary concentration co = 1/a3, of one particle per binding site, where a is a length scale associated with the linear dimension of a binding site (for a = 1 nm, co = 1 M); (ii) the ratio of the unbinding and binding rates for one unit: ρ = e−ε, where ε is the binding energy in kBT units. Time is expressed in terms of the time scale to, equal to the the self-diffusion time for one unit of the protein: to = 2πηa3/kBT ≈ 1.6 10−9 s, for a ≈ 1 nm, η = 0.001 Pa s and kBT = 4 10−21 J. In units of 1/t0 the zipping rate of a protein unit on a free binding site is equal to one.

