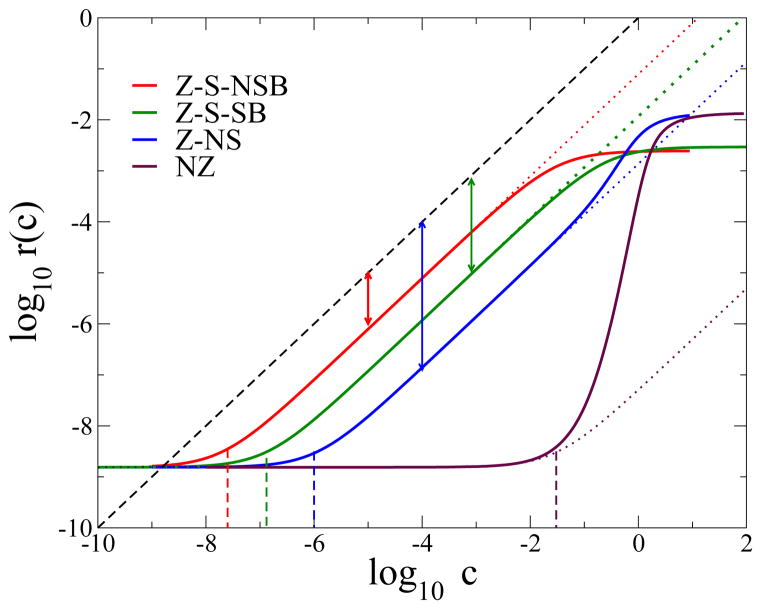
FIG. 2.
Unbinding rates r(c) (full lines) from Eq. (2) versus dimensionless concentration c and for parameters N = 10, ε = 2. The zero-concentration rate, r(0) = 1.8 10−9 (units of 1/t0), is the same for all four models. The concentrations cR at which replacement starts to dominate over pure thermal unbinding, i.e. r(c) starts to vary linearly with c, are indicated by the vertical dashed colored lines for the four models; cR = 3 10−2 for NZ, 2 10−6 for Z-NS, 2 10−8 for Z-S-NSB, and 1.3 10−7 for Z-S-SB (units of c0). The offsets between the linear regimes of the rate curves (dotted lines, from Eq. (3)) and the r = c (dashed black) line are log R (log of replacement rate, double arrow vertical lines); R is approximatively equal to 10−1 for Z-S-NSB, 10−2 for Z-S-SB and 10−3 for Z-NS. The dotted lines are only visible when the linear approximation breaks down.

