
Figure 1.
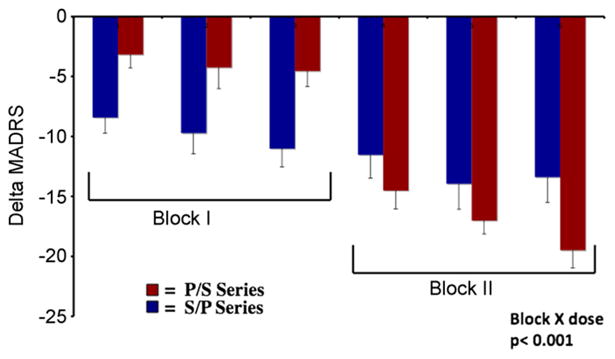
Mean change in Montgomery-Åsberg Depression Rating Scale (MADRS) over sessions relative to the first baseline session is shown for the group who received placebo (P) in block 1 and scopolamine (S) in block 2 (P/S; red bars) and the group receiving scopolamine in block 1 and placebo in block 2 (S/P; blue bars). The 52 participants whose data are represented in this graph were pooled from the randomized controlled trials described in the text (31,43,44). Errors bars reflect standard error.