
Figure 6. SINGLE REPEATED training effect.
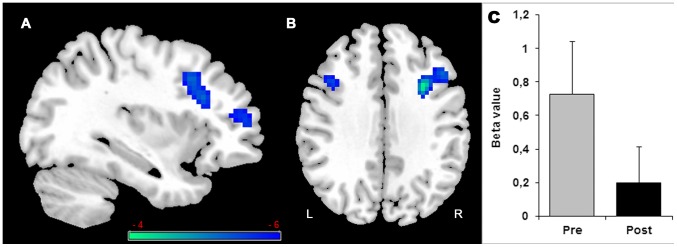
Decreased (Pre>Post) activation in single-task with alphanumeric equation is found in the right inferior and middle frontal gyrus (A and B) and left middle frontal (B). Histogram in (C) indicates the Beta value (activity estimates ± SE) in right inferior and middle frontal gyrus. The threshold for display is P<0.001, uncorrected, 10 voxels. Coloured bar is representative of t scores mentioned in Table 5. “L” denotes the left side of the brain, while “R” denotes the right side.