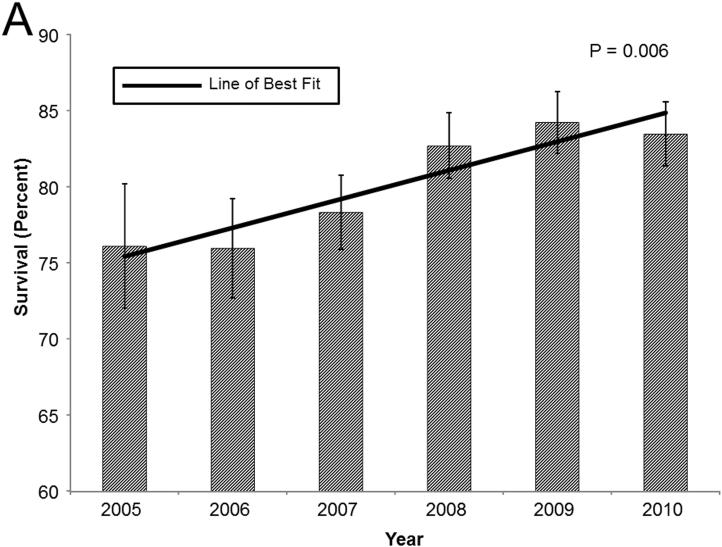
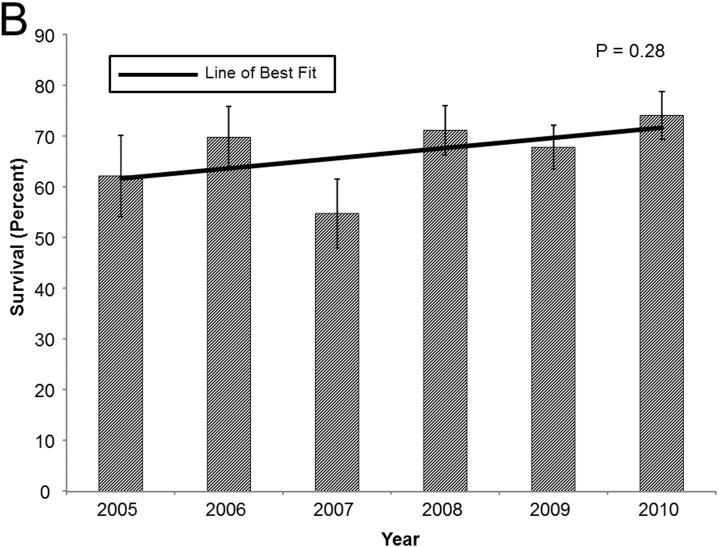
Figure 3.
Bar graphs of 1-year survival stratified by year for (A) recipients in the highest LAS quartile, (B) recipients requiring ventilatory support, and (C) recipients requiring ECMO support. Survival was determined by the Kaplan-Meier method. Error bars denote standard error. Solid line represents the line of best fit. P-values were determined by linear regression.


