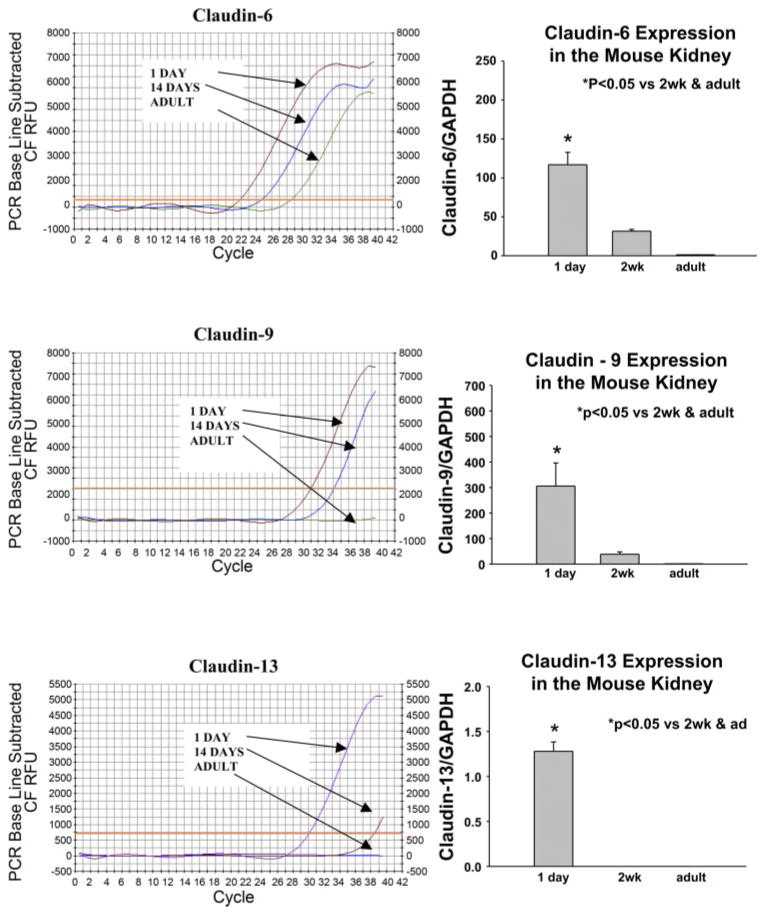
Fig. 3.
PCR profile for claudin 6, 9, 13 in 1-day-old, 2-wk-old, and adult mice kidney using quantitative real-time RT-PCR. To the right of each profile is a summary of experiments showing a developmental decrease in mRNA expression. This difference in these claudin isoforms was significant showing a maturational change during postnatal development.

