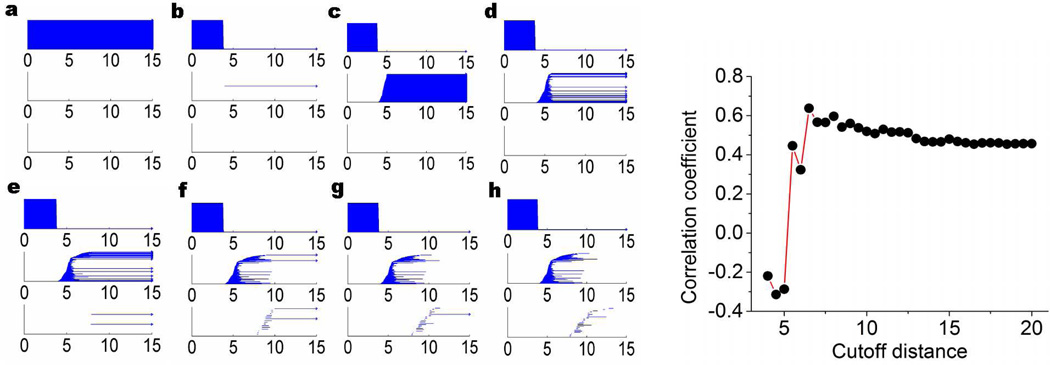
Figure 15.
Visualization of topological connectivity and optimal cutoff distance of Gaussian network model for protein 3MRE. The left charts from a to h are the barcodes generated based on the filtration given in Eq. (25). From a to h, the cutoff distances used are 3Å, 4Å, 5Å, 6Å, 8Å, 10Å, 12Å, and 14Å, respectively. The right chart is the correlation coefficient obtained from the Gaussian network model under different cutoff distance (Å).

