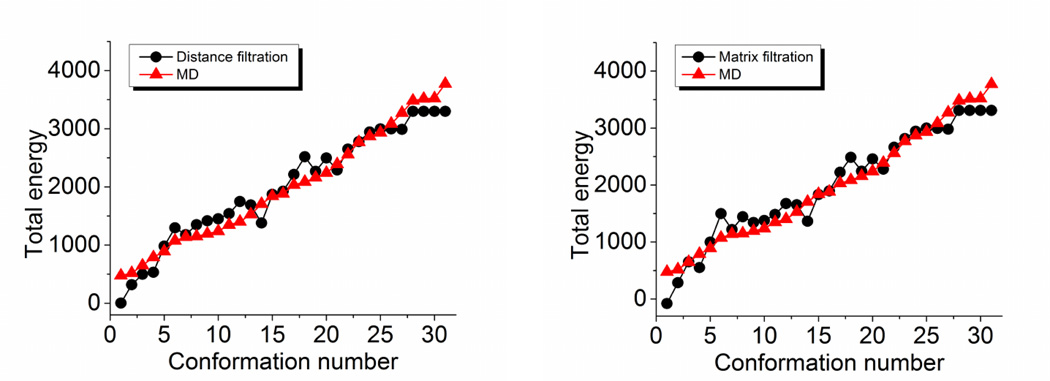
Figure 22.
Comparison between the total energy and the persistent honiology prediction for 31 configurations of protein 2GI9. The negative accumulation bar length of is used in the persistent honiology prediction with both distance based filtration (left chart) and correlation matrix based filtration (right chart). Their correlation coefficients are 0.972 and 0.971, respectively. The linear correlation between the negative accumulation bar length and total energy is confirmed.

