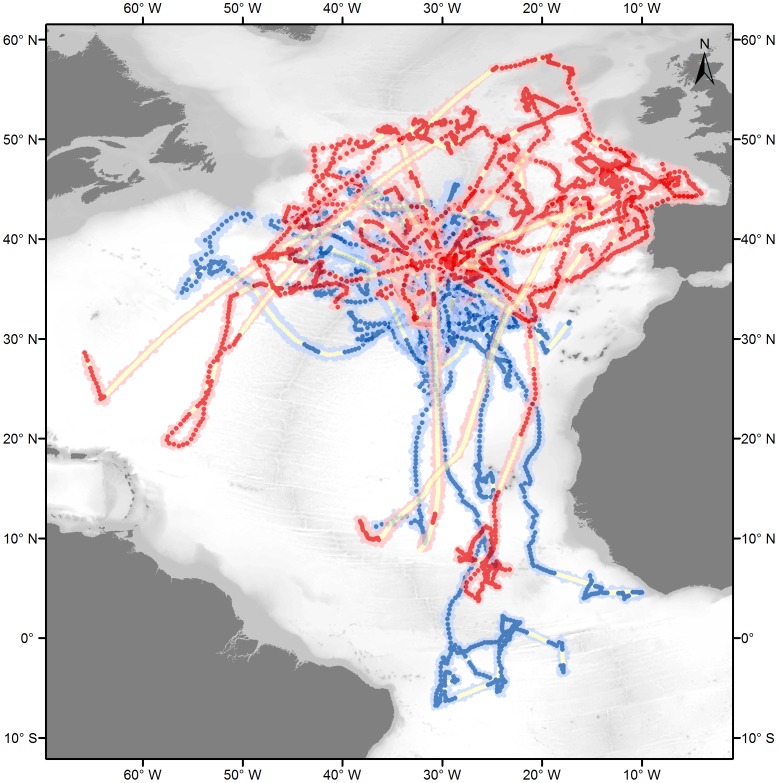
Figure 1. Reconstructed migratory pathways of blue sharks tagged in the Azores.
Red and blue dots represent the most probable daily position estimates of respectively female and male sharks, with pink and light blue clouds representing the respective errors around the position estimates. Yellow dots indicate data gaps (i.e. days without position information within 72 h intervals).

