
Figure 10. Aggregated long-term time at Sea Surface Temperature (SST, °C) profiles for male (grey) and female (black) blue sharks belonging to different life stages.
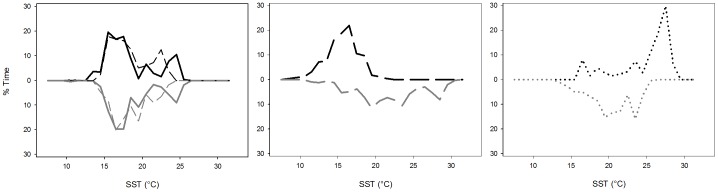
Top panel: Small Juveniles (SJ); Centre panel: Large Juveniles and Sub-adults (LJ); Bottom panel: Adults (AD). SST values were obtained from averaged (1°) monthly SST images for NOAA's CoastWatch program, except for the dotted curves in the top panel that were obtained directly from the Mini-PAT tags.