
Figure 1. Kaplan-Meier estimates of survival outcomes in the entire cohort.
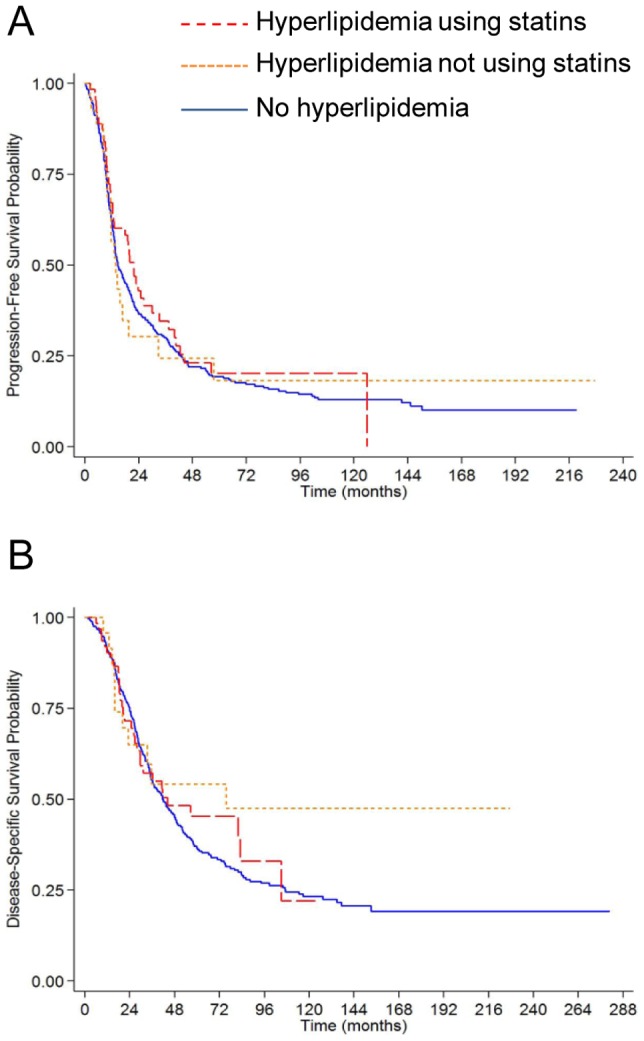
The three groups are ovarian cancer patients with hyperlipidemia using statins (red long dashed line, n = 68), with hyperlipidemia not using statins (orange short dashed line, n = 28), and patients without hyperlipidemia (blue solid line, n = 346). p values are from the log-rank test. (A) Progression-free survival; (B) Disease-specific survival.