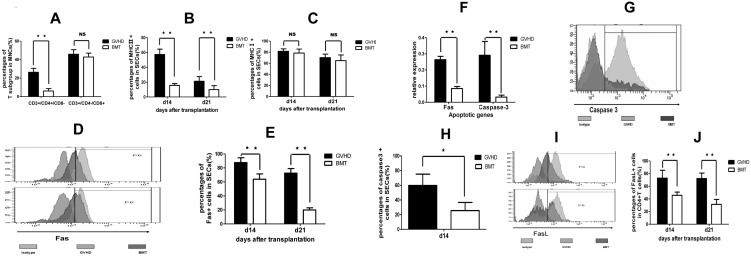
Figure 6. CD4+ T-cell mediated vascular niche damage in GvHD.
(A) Percentages of CD4+ and CD8+ donor T cells in MNCs in BM at 14 days after transplantation. (B) MHC-II expression in BM SECs. (C) MHC-I expression in BM SECs. (D) Representative flow cytometry profile of Fas expression in BM SECs. (E) Percentages of Fas+ cells in SECs. (F) Expression of Fas and caspase-3 in BM SECs measured by RT-PCR. (G) Representative flow cytometry profile of caspase-3 expression in BM SECs. (H) Percentages of caspase-3 positive cells in SECs. (I) Representative flow cytometry of FasL in donor CD4+ T cells. (J) Percentages of FasL+ CD4+ donor T cells in MNCs. Data are shown as mean ± SD and from 1 of 3 experiments with similar results (Only one experiment for caspase-3 expression). **P<0.01; NS: no significant (n = 4, t-test).

