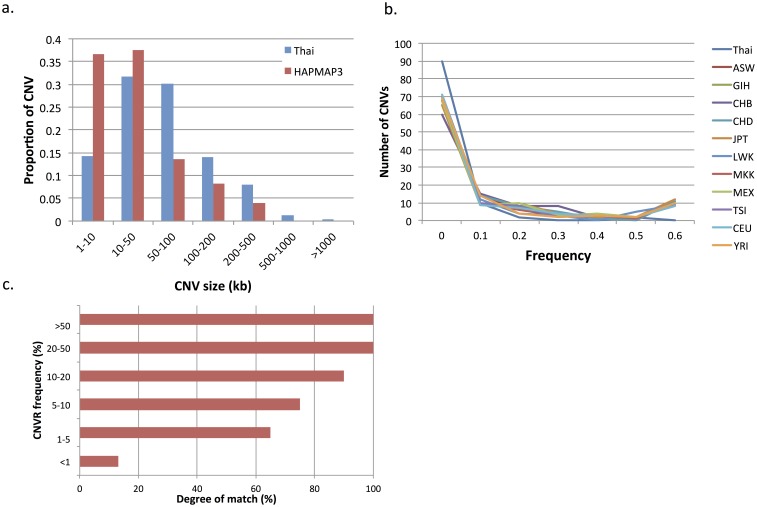
Figure 2. CNV and CNVR comparison between the Thai and eleven HapMap3 populations.
a) Size distribution of the Thai CNVs and HapMap3 CNVs; b) Allele frequency spectrum of CNVs with frequency of at least 1% across the Thai and HapMap3 CNVRs; c) Degree of match between the Thai CNVRs and HapMap3 CNVRs with reference to allele frequency.

