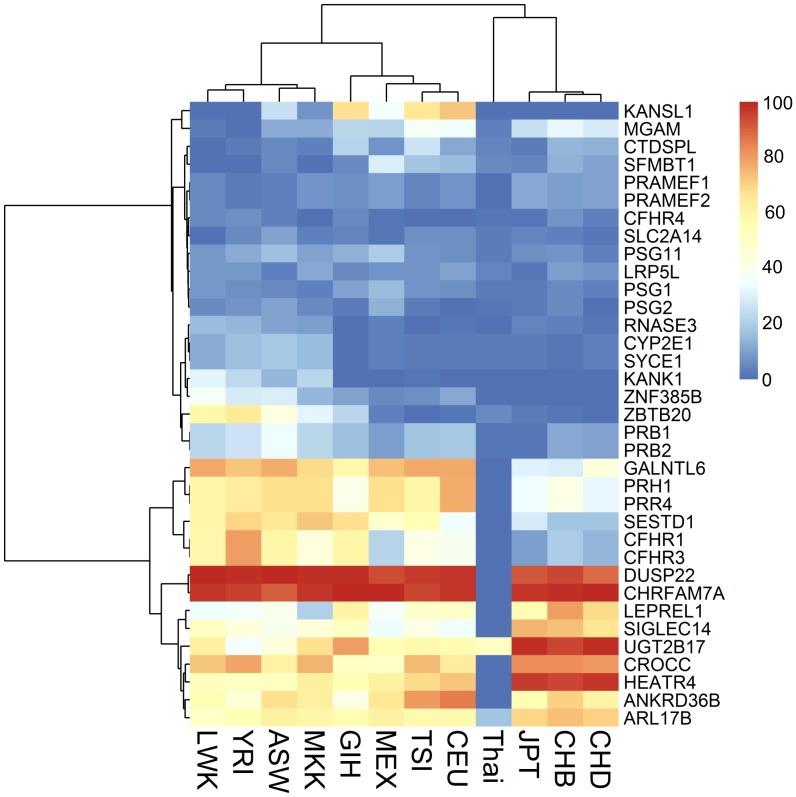
Figure 3. Hierarchical clustering analysis (HCA) of the 35 genes overlapping CNVs with statistically significantly different allele frequencies across HapMap3 populations as compared with Thais (permutation P-value <0.0002).
The color bar on the right shows the color codes assigned to each frequency range in percent.

