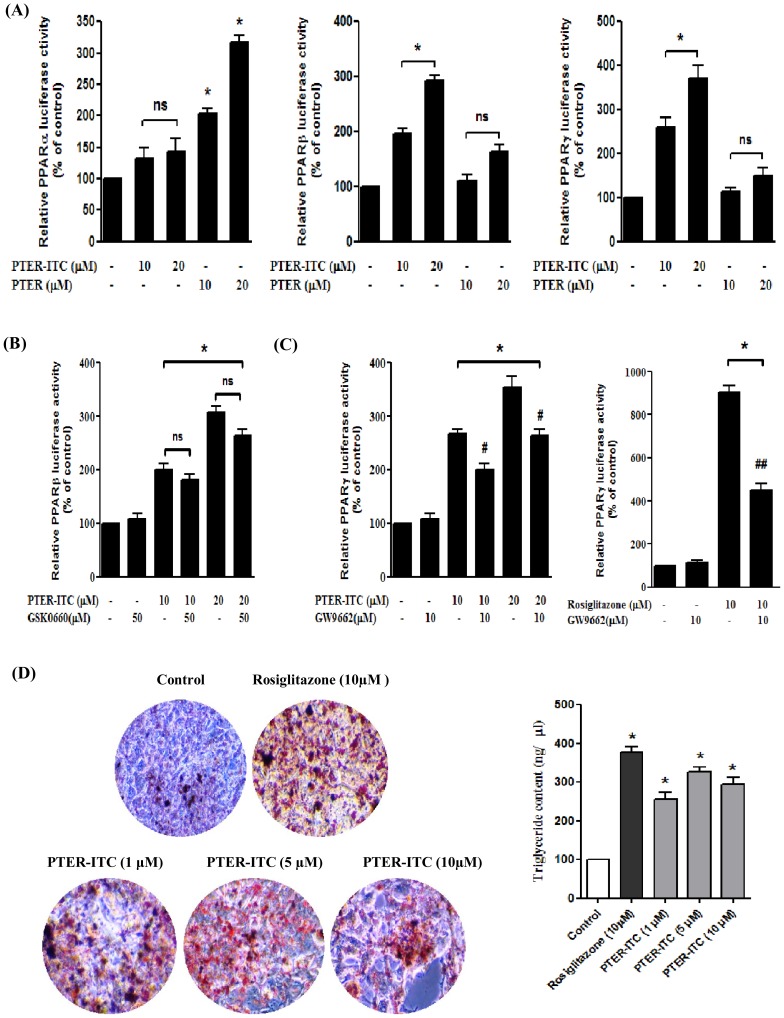
Figure 4. PTER-ITC alters PPAR activity and induces differentiation of MCF-7 cells.
(A) Effect of PTER-ITC and PTER on the activity of various PPAR in MCF-7 cells, as determined by transactivation assay. Data are expressed as a percentage of PPAR activity relative to the respective control. Values shown as mean ± SEM of three independent experiments. * indicates significant difference relative to vehicle-treated control; p<0.05. (B) Effect of PPARβ inhibitor (GSK0660) and (C) PPARγ inhibitor (GW9662) and activator (rosiglitazone) on PTER-ITC-induced transactivation of PPAR. Cells were transfected with pcMX-PPARβ/γ plasmids, together with PPRE-tk-luc and Renilla plasmids (18 h). Cells were then pre-treated with GSK0660/GW9662 (4 h), followed by PTER-ITC/rosiglitazone treatment (24 h). Data are expressed as percentages of PPARβ/γ activity relative to the vehicle-treated control ( = 100). Values are shown as mean ± SEM of three independent experiments. *, # and ## indicate statistically significant difference compared to respective controls, only PTER-ITC (either 10 or 20 µM) and rosiglitazone-treated groups, respectively; p<0.05. ns, not significant. (D) Oil Red O staining showing lipid accumulation in MCF-7 cells treated with different doses of PTER-ITC and rosiglitazone (10 µM), observed by light microscopy (200x). Histogram (right) shows spectrophotometric estimation of intracellular neutral lipids. Values shown as mean ± SEM of two independent experiments. * indicates significant difference relative to vehicle-treated controls; p<0.05.

