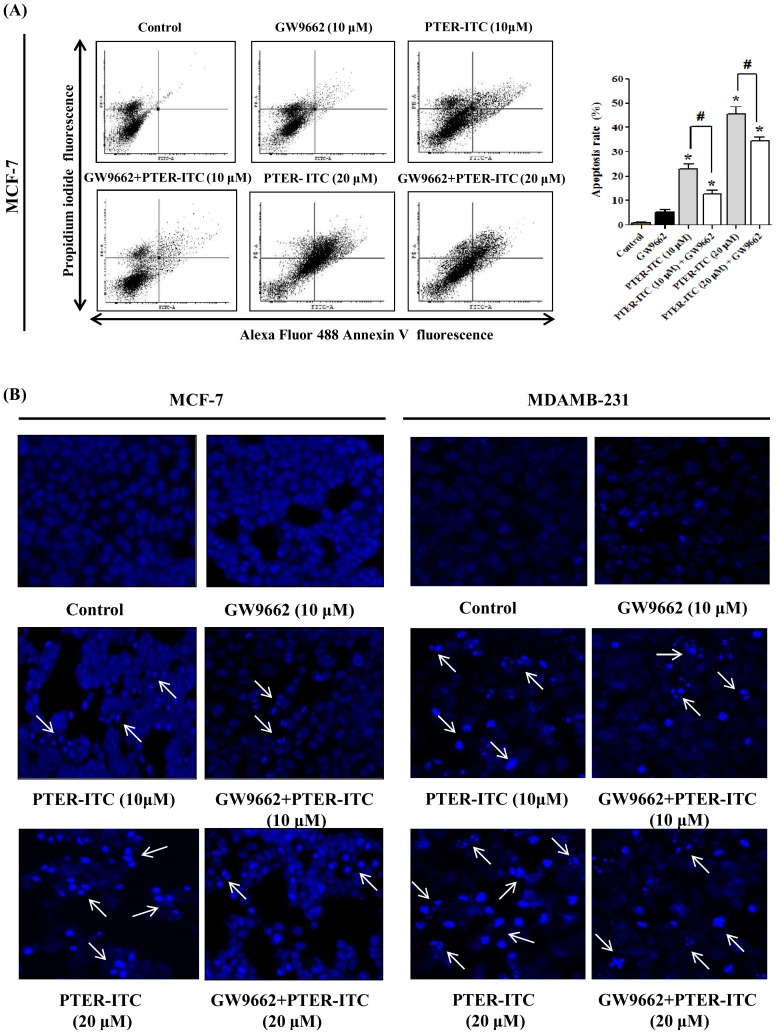
Figure 6. PTER-ITC induces PPARγ-dependent apoptosis in breast cancer cells.
(A) Representative FACS analysis of cells using annexin V as marker. Histogram (right) shows the apoptosis rate induced by PTER-ITC alone and in the presence of GW9662. Values are mean ± SEM from three independent experiments. * and # indicate statistically significant differences compared to vehicle-treated control and only PTER-ITC treated groups, respectively; p<0.05. (B) Apoptosis induced by PTER-ITC alone and in the presence of GW9662, visualized by fluorescence microscopy using DNA-binding fluorochrome DAPI in MCF-7 and MDA-MB-231 breast cancer cells. Figures show a representative experiment of three performed. Magnification, 200×. Arrows indicate the formation of apoptotic bodies.

