
Figure 2. Analysis of western blot results of TRPV1 expression in the nucleus accumbens (NAc).
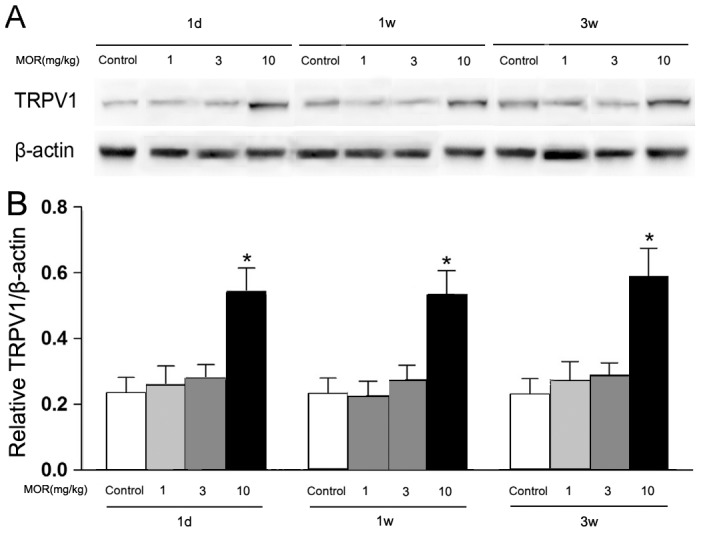
(A) Representative blots of TRPV1. β-actin showed similar protein loading in each group. (B) Densitometric analyses of TRPV1 expression in NAc. The changes were expressed as the ratio to β-actin. Data represent Mean±SEM (n = 3), *p<0.01, vs control group.