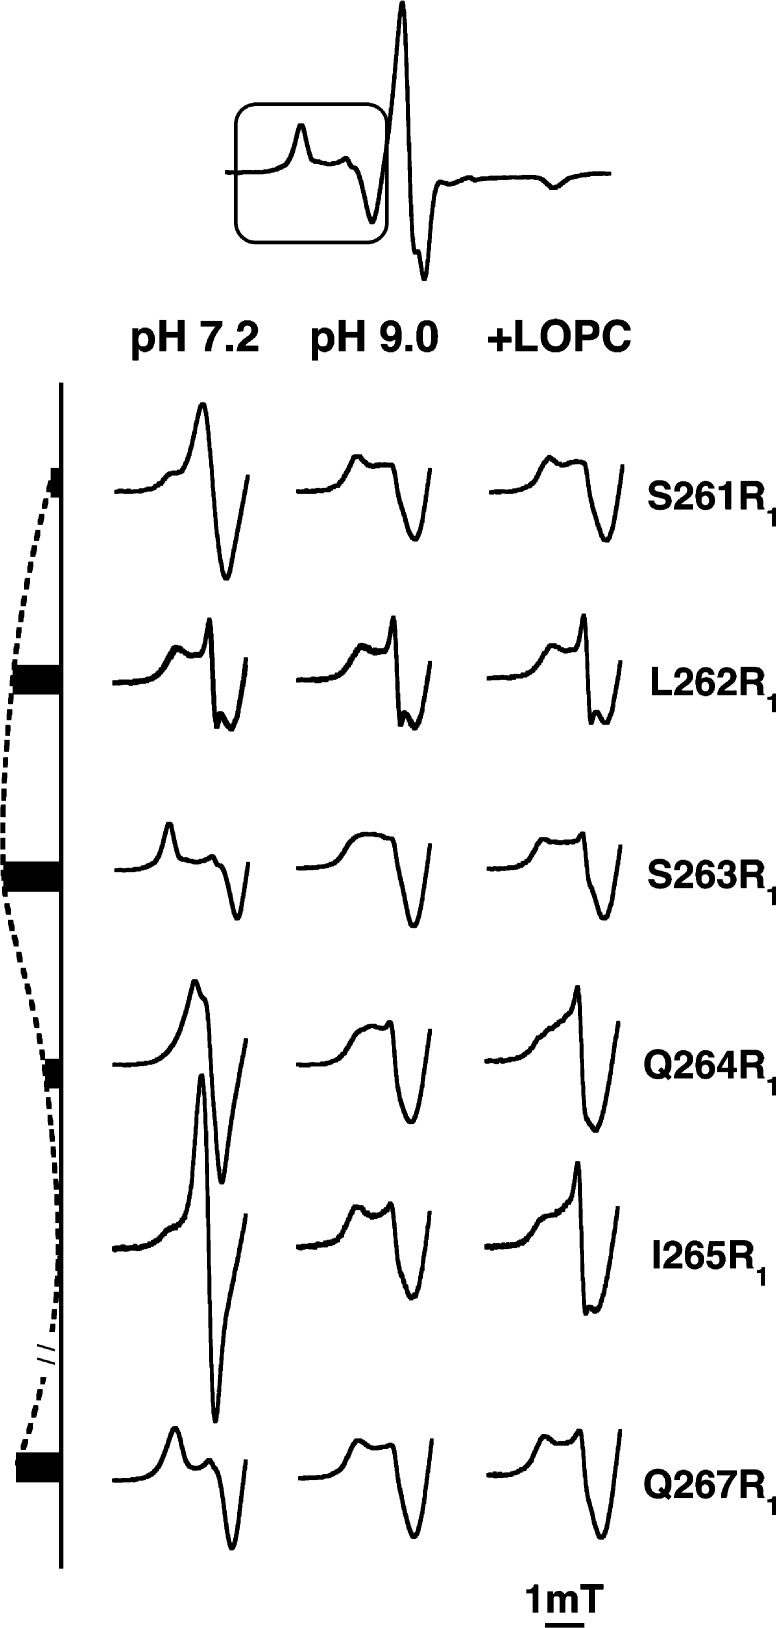
Figure 2.
Dynamic changes in middle portion of helix 2 in response to pH and lipid. The low-field region (in the box of the full spectrum at the top) of X-band EPR spectra (9.404 GHz) for spin-label residues 261–267 (100 mM) in SBL1 helix 2 is shown. Spectra were recorded at 295 K. The three columns show EPR spectra for samples prepared at pH 7.2 (first column of spectra), pH 9.0 (middle column), and pH 9.0 with addition of lyso-oleoylphosphatidylcholine (LOPC, 200 mM). The bars, left of the spectra, indicate the magnetic field shift of the first maximum in the EPR spectra of the pH 7.2 samples compared to that of I265R1. The dashed line is a visual guide to illustrate the range in magnitude of these shifts in pH 7.2 samples.

