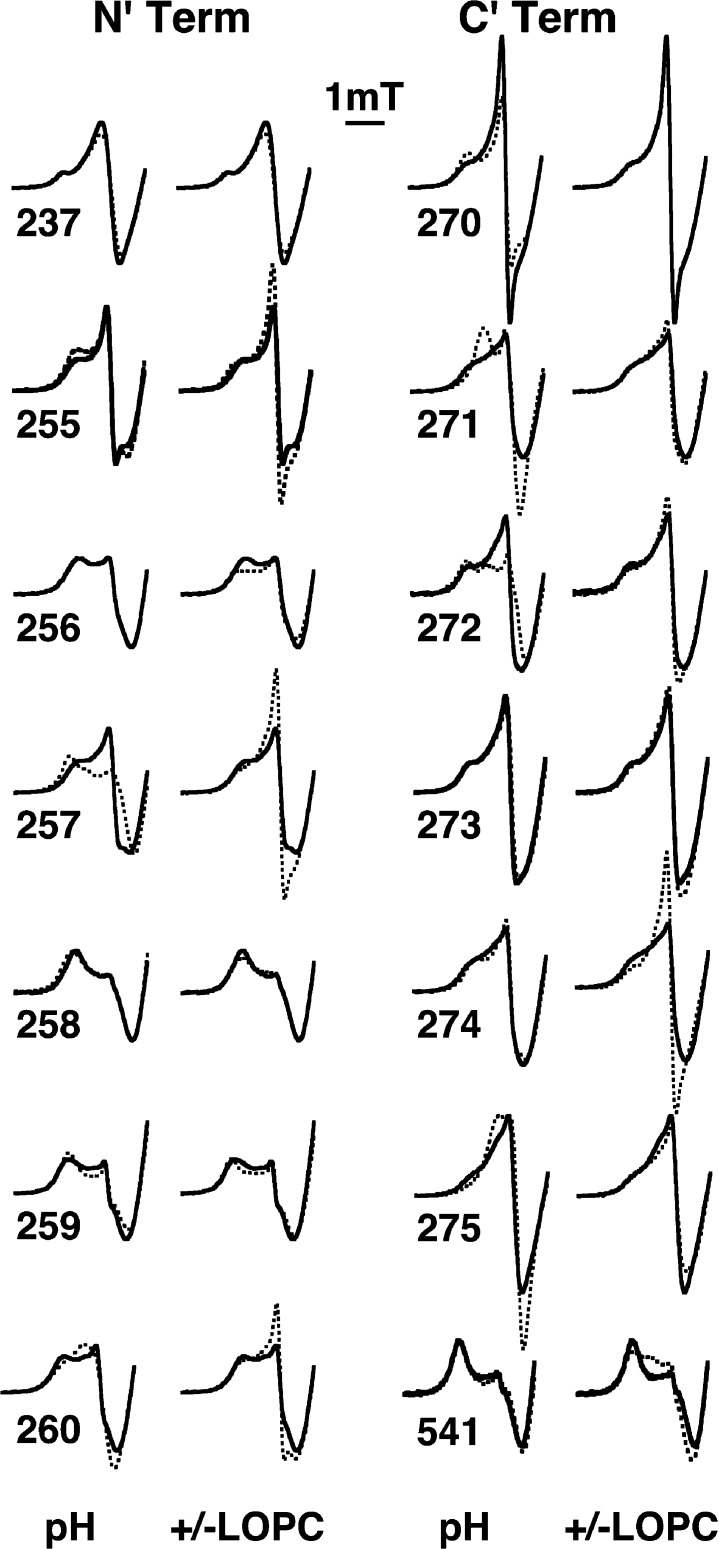
Figure 3.
Response of N-terminal and C-terminal regions of helix 2 to changes in pH and addition of lipid. Solution X-band EPR spectra are shown for spin-labeled residues at the N-terminal (residues 255–260) and C-terminal (residues 270–275) ends of SBL1 helix 2. Spectra with solid lines are from samples at pH 9.0. For the effect of pH, dotted lines are results for samples at pH 7.2; for the effect of addition of LOPC, dotted lines are results for LOPC addition at pH 9.0. Other experimental conditions are the same as those given in the legend of Figure 2. Data for two spin-labeled mutants outside of helix 2, V237R1 (top left) and L541R1 (bottom right), are also included.

