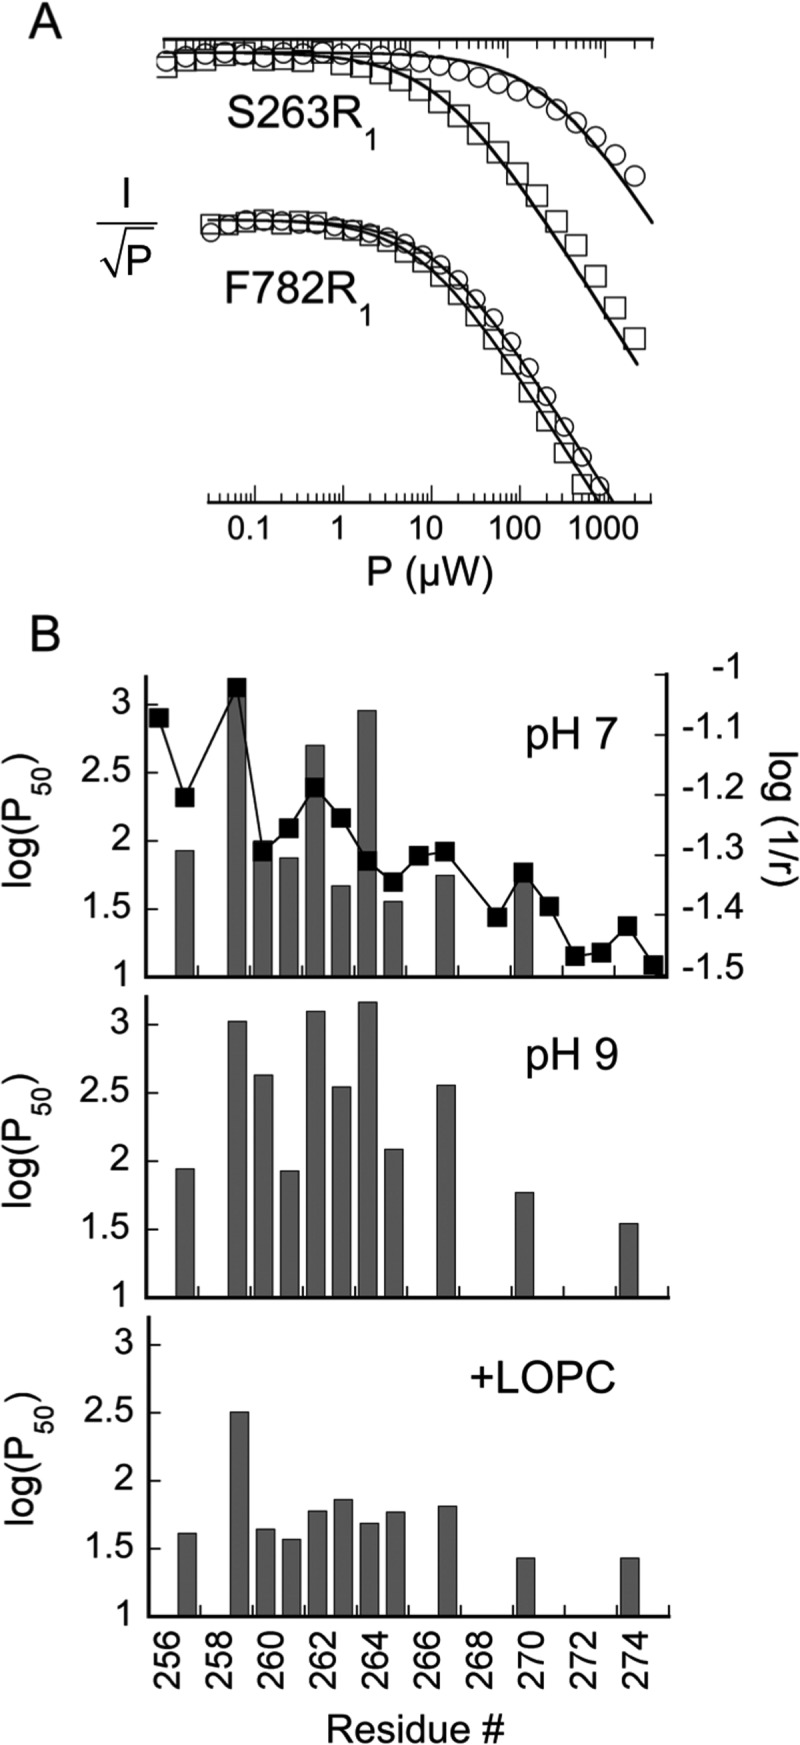
Figure 4.

Summary of power saturation data at 60 K for R1 mutants in helix 2. (A) Representative power saturation plots for two spin-labeled mutants near (S263R1) and farther (F782R1) from the expected LOPC binding site. Results from samples at pH 9.0 with LOPC [(□) 75 μM protein and 150 μM lipid] and without [(○) 85 μM protein] are compared. (B) Graphical summary of saturation results for spin-labeled SBL1 helix 2 at pH 7 (top) and at pH 9, without (middle) and with addition of LOPC (bottom). Values of log(P50) (units of microwatts, left ordinate) are compared across the spin-labeled residues in helix 2. For comparison, in the top panel, pH 7 data are compared with log(r)−1 (r units in angstroms, right ordinate), where r is the distance from iron of the final atom of the natural side chain in the 1YGE structure.
