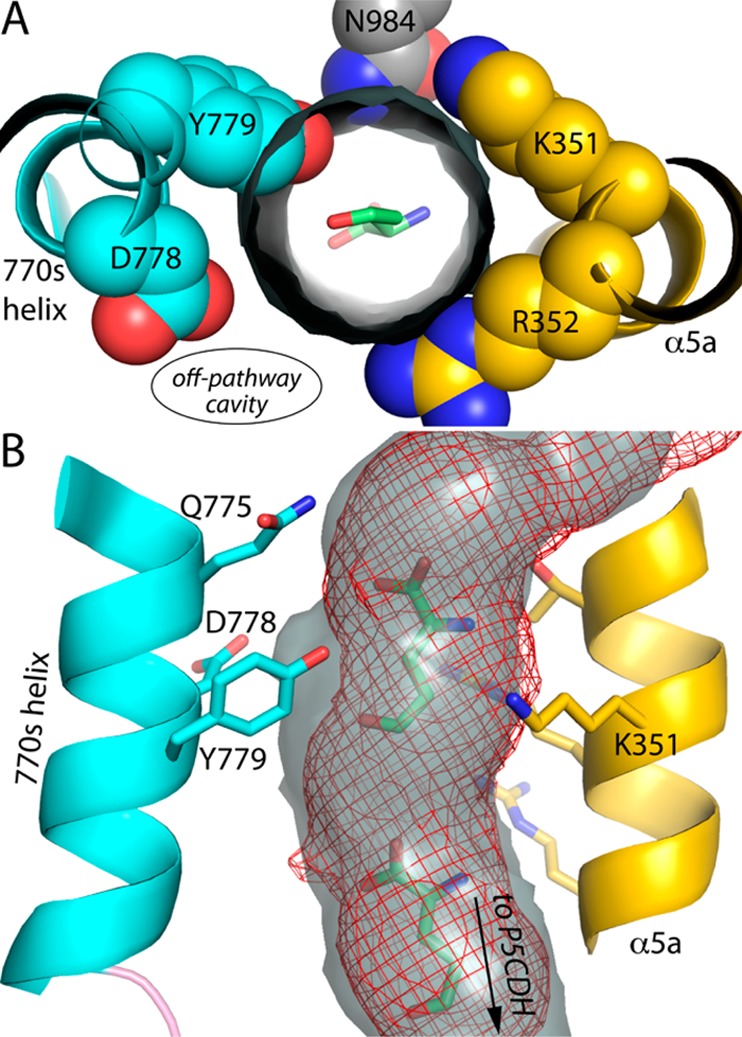
Figure 8.

Constriction of the channeling tunnel by Tyr779 in D779Y. (A) The gray cylinder represents the channeling pathway calculated from the wild-type BjPutA structure (PDB entry 3HAZ) using MOLE, and the view is from the P5CDH active site looking through the tunnel toward the PRODH site. (B) Comparison of the predicted channeling pathway of wild-type BjPutA (gray surface) and D779Y (red mesh).
