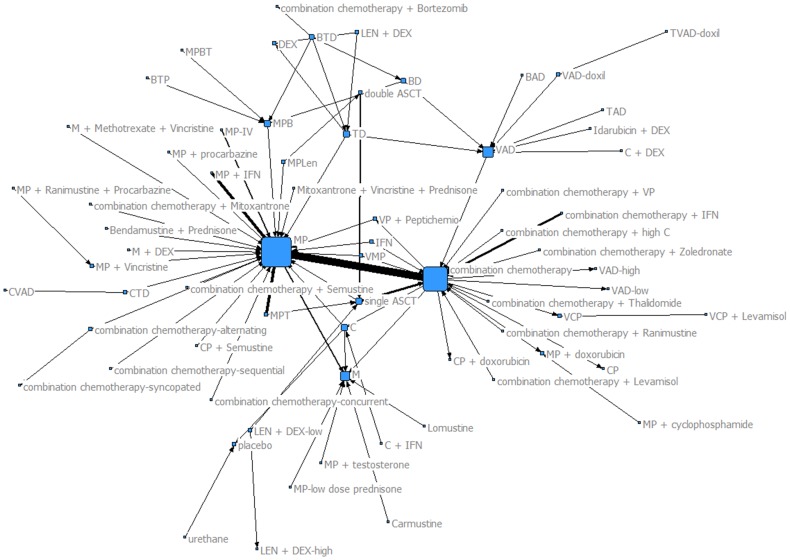
Figure 1. Connected component of RCT treatment network.
Each node is associated with a treatment tested in an RCT and each tie denotes a comparison between two treatments. The width of the ties among treatments denotes the number of times two treatments have been tested in RCTs. The network represents the connected component of the network depicted in Figure S1 in File S1 and it is comprised of 155 treatment comparisons. The most frequently tested comparison is between combination therapy and MP.

