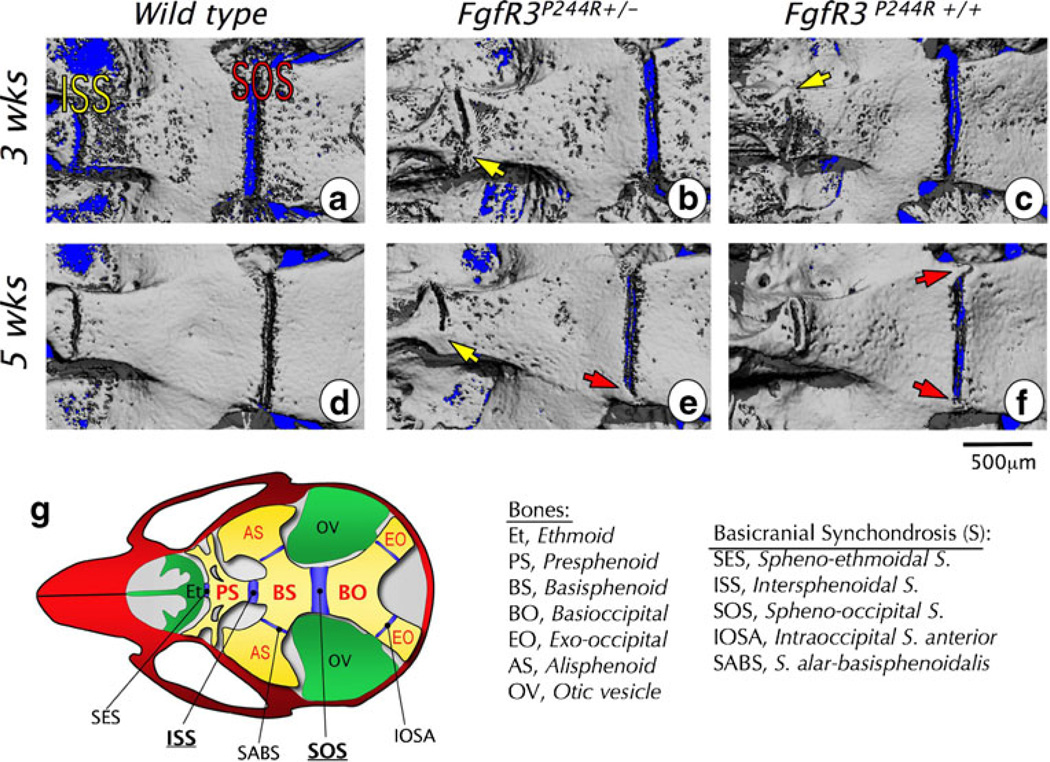
Fig. 4.
Micro-CT images of basicranial synchondrosis closure in wild-type and heterozygous (FgfR3P244R+/−) and homozygous (FgfR3P244R+/+) mutant mice. a–f Skull bases of wild-type (a, d), heterozygous mutant (b, e), and homozygous mutant (c, f) mice are imaged at 3 weeks (a–c) and 5 weeks (d–f). In all images, left is rostral and right is caudal. Bridged or closed intersphenoidal synchondrosis (ISS) is indicated with a yellow arrow and the bridged or closed spheno-occipital synchondrosis (SOS) with a red arrow. Scale bar0500 µm. g The diagram illustrates locations of and relationships among synchondroses and bones in the cranial base. (Adopted from Developmental Dynamics 240(11):2584–2594, 2011)

