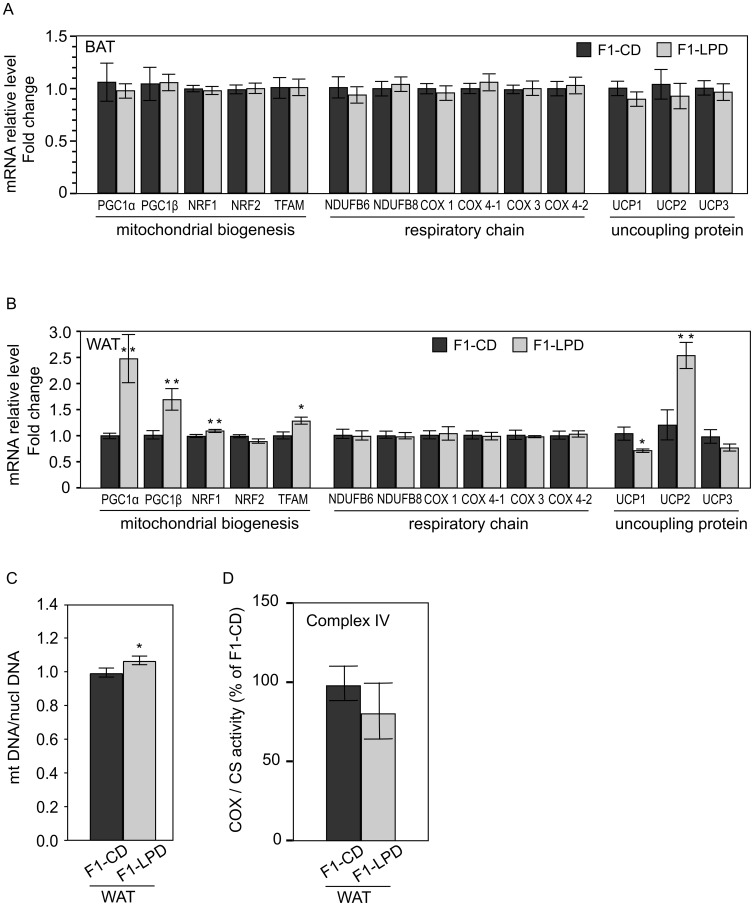
Figure 4. mRNA expression levels in Brown and White Adipose Tissue, Cytochrome C Oxidase and Citrate Synthase Activities and Mitochondrial DNA content in White Adipose Tissue of F1 mice.
A, B) mRNA expression levels of genes encoding proteins involved in the mitochondrial function in (A) Brown Adipose Tissue (BAT) and (B) White Adipose Tissue (WAT) from 7-months-old F1-CD and F1-LPD males mice. mRNA relative levels are normalized relatively to Nono expression level and expressed as fold change relative to the control value measured in F1-CD. Values are means ± sem for at least 8 mice/group. **p≤0.05, *p≤0.08. C) Cytochrome C Oxidase (COX = Complex IV) and Citrate Synthase (CS) activities are measured in WAT from 7-months-old F1-CD and F1-LPD males mice and expressed as a percentage of the COX/CS ratio of F1-CD mice. Values are means ± sem for at least 8 mice/group. D) Mitochondrial density is estimated by measuring the mitochondria DNA (mtDNA) content relatively to the nuclear DNA (nuclDNA) content in White Adipose Tissue. mtDNA/nuclDNA ratio was calculated as the ratio of COX1 to cyclophilin A DNA levels, determined by real-time PCR, in DNA extracted from White Adipose Tissue of 7-months-old F1-CD and F1-LPD males mice. Results were normalized by the mean value of the control condition set to 1 unit. *p≤0.05.

