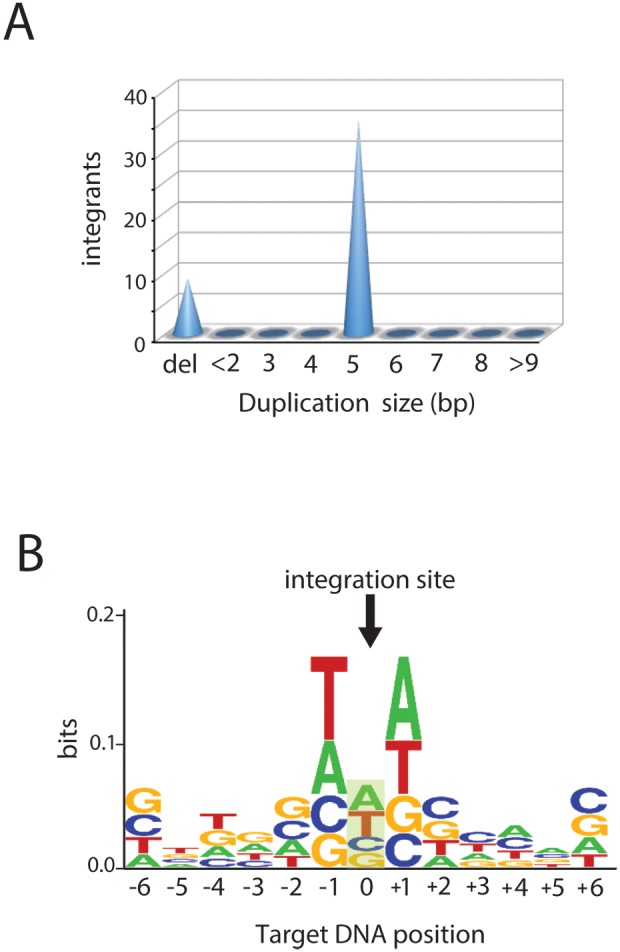
Figure 3. Sequence analysis of concerted integration products.

A, Cone presentation of target duplication size distribution or deletions in concerted integrants. 36 clones contained a 5 bp duplication. 10 clones contained a short terminal deletion, likely resulting from contaminating DNA from the smear below the concerted integration product. B, Weblogo representing nucleotide base frequencies at the junction of concerted integration products (n = 72). The arrow indicates the middle position of the 5 bp target site duplication. Alignment of integration site revealed a weak consensus target sequence (GTA/TAC). The overall height of the stack indicates the sequence conservation at that position, while the height of symbols within the stack indicates the relative frequency of each nucleotide at that position. The figure was created by WebLogo.
