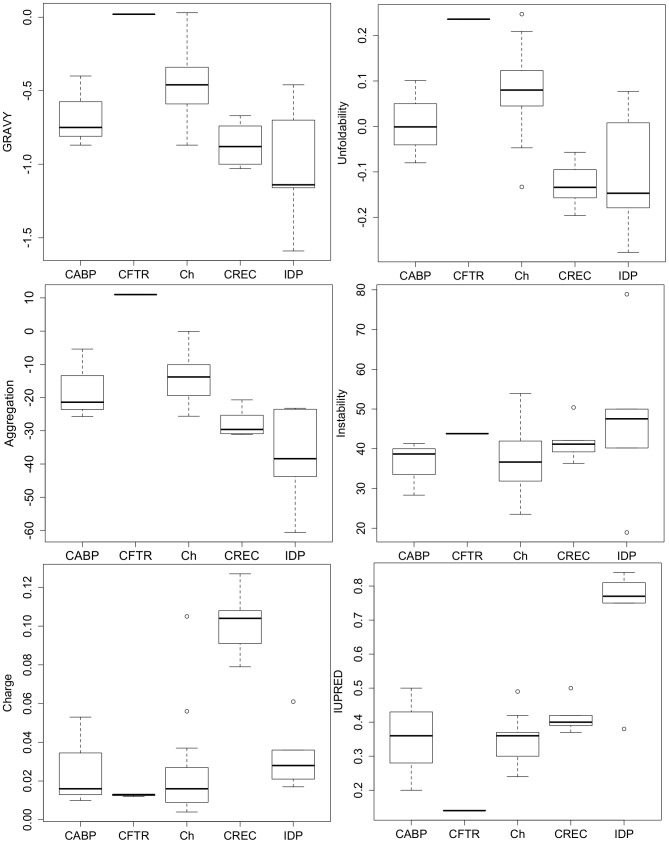
Figure 1. Box-plots showing GRAVY, Unfoldability, Aggregation, Instability, Charge and IUPRED (disorder) measurements.
Protein groups used in this analysis are the following: Calcium binding proteins (CABP), CFTR wild-type and mutant (F508del and G551DCFTR) proteins (CFTR), chaperones (Ch), CREC proteins (CREC) and intrinsically disordered proteins (IDP). CREC proteins demonstrated significantly lower hydropathy (GRAVY) scores compared to CFTR proteins (p-value<0.01). These proteins also showed lesser unfoldability compared to CFTR proteins (p-value<0.001) and chaperones (p-value<0.01). In terms of aggregation, CREC proteins posses significantly less proportion of aggregation prone residues in their sequences compared to calcium binding proteins and CFTR proteins (p-values<0.01 and <0.001 respectively). No significant difference between groups was observed for Instability scores. CREC proteins showed a significantly greater amount of charge compared to chaperones (p-value<0.05). IDPs were also significantly more disordered compared to chaperones (p-value<0.05).

