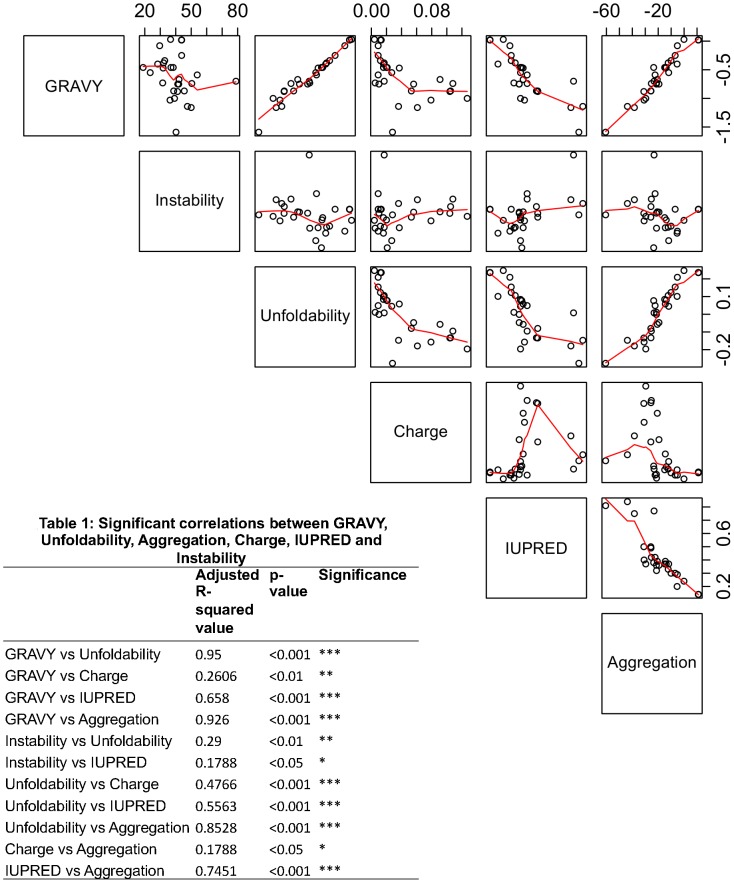
Figure 2. Correlation plots for GRAVY, Unfoldability, Aggregation, Instability, Charge and IUPRED (disorder).
In each plot, the y-axis is represented by the score highlighted in each row of the matrix, while it's corresponding x-axis is depicted by parameters described in the rows above or below it. Table 1 shows the pair-wise correlation values for all the parameters analyzed.

