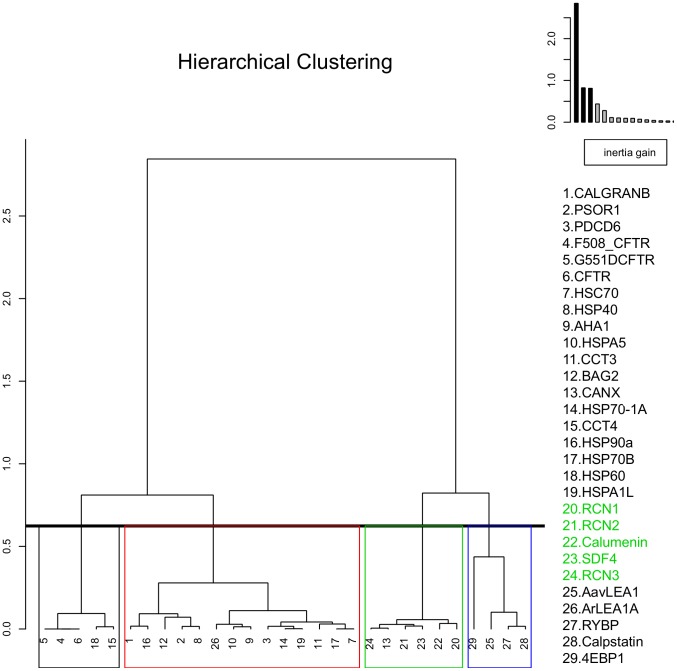
Figure 4. Hierarchial clustering of proteins based on their biophysical features.
Sequential clustering was performed by computing the Euclidean distance matrix and by following the Ward's criterion after data transformation during PCA. A dendrogram was drawn, where each vertical line represents a cluster and a horizontal line connecting between any two vertical lines represents the merger of clusters, where its height is related to the dissimilarity measure between the merged clusters. Inertia is defined as multidimensional variance and can be decomposed as variance observed “between” and “within” different clusters, where Ward criterion aims to minimize the increase or “gain” of “within inertia”. As can be observed on the plot on the top right hand corner, a step-wise decrease in inertia was performed until no further decrease was observed for different clusters. CREC proteins are observed in a single cluster (green) along with calnexin, chaperones and calcium binding proteins are observed to be inter-related in a separate cluster (red), while CFTR proteins (black) and disordered proteins cluster separately (blue). CREC proteins are shown in green text.

