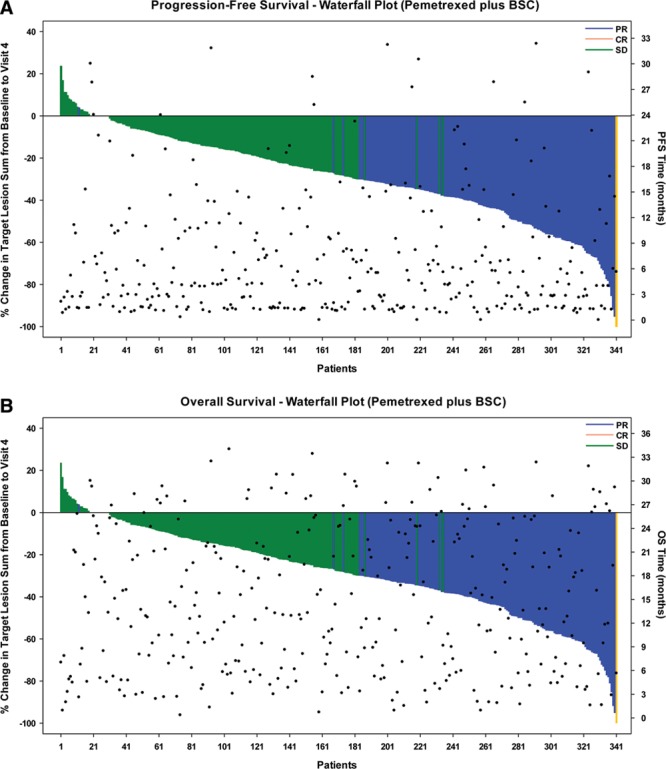
FIGURE 1.

Waterfall plot of induction response of patients treated with pemetrexed. The waterfall plots display individual patient induction response data expressed as percent change in the sum of the longest diameter of target lesions as measured at baseline and visit 4 of the induction period. Best induction tumor response for each patient (SD, PR, or CR) is indicated by the color of the data bar. A, PFS time (months) (right y axis) for each patient as indicated by points. B, OS time (months) (right y axis) for each patient, also indicated by points. SD, stable disease; PR, partial response; CR, complete response; PFS, progression-free survival; OS, overall survival; BSC, best supportive care.
