FIGURE 2.

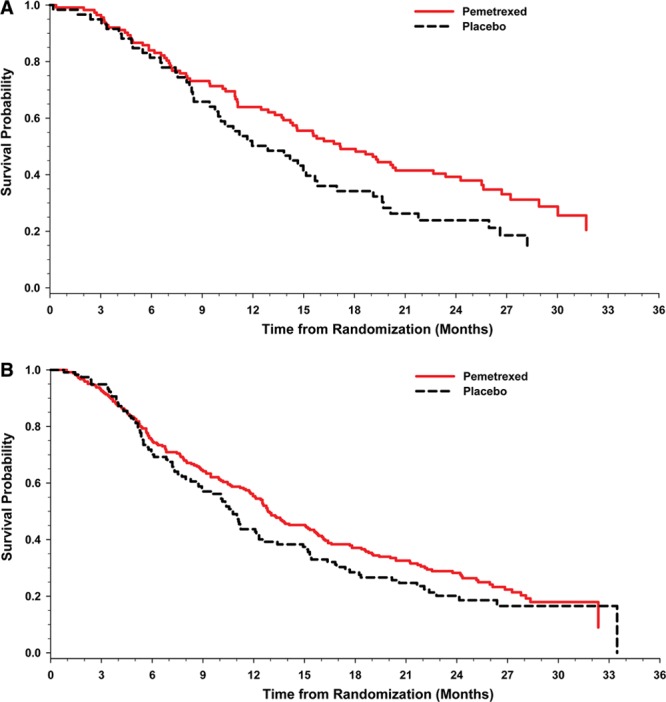
Kaplan–Meier plots of overall survival in performance status subgroups. The Kaplan–Meier plots depict overall survival by performance status 0 (A) and overall survival by performance status 1 (B).

Kaplan–Meier plots of overall survival in performance status subgroups. The Kaplan–Meier plots depict overall survival by performance status 0 (A) and overall survival by performance status 1 (B).