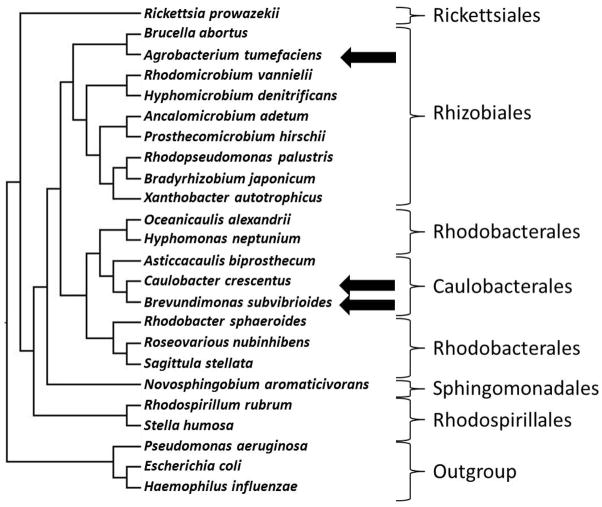
Figure 1.
Phylogenetic tree of select Alphaproteobacteria. Brackets indicate orders within the Alphaproteobacteria. Organisms of interest to this study are indicated with arrows. To generate the phylogenetic tree, gyrA sequences from representative species were aligned using MUSCLE (Edgar, 2004). RAxML reconstructed the maximum likelihood phylogeny using the JTT amino acid substitution matrix and a four-category discrete gamma distribution of sequence rate variation among sites (Stamatakis, 2006).

