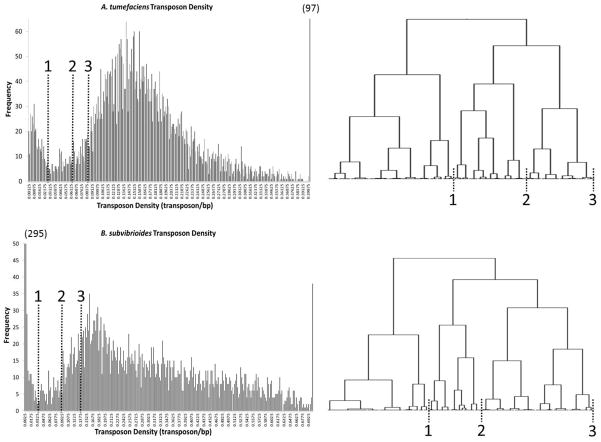
Figure 2.
Distribution of internal transposon densities. The transposon density of the internal 60% of each ORF was plotted on a histogram. The distribution shows that each organism has a population of densities close to the Y-axis (essential genes) and a larger population with higher density (non-essential genes). Genes are present in the trough area between the peaks that likely contains essential genes as well as genes that have a significant growth defect when disrupted. Numbers in parenthesis represent the height of bars exceeding the Y-axis (97 for above 0.4 of A. tumefaciens and 295 for the 0-0.0025 range of B. subvibrioides). To the right of each distribution is a portion of the Ward’s cluster analysis performed using the internal transposon densities. The portions displayed cover the essential gene peak, trough, and early non-essential gene peak. Dashed lines indicate where major cluster divisions correspond to portions of the distribution. Genes from the Y-axis to line 1 were classified as essential, from line 1 to line 2 as unresolved, and from line 2 onward as non-essential.

