Figure 1.
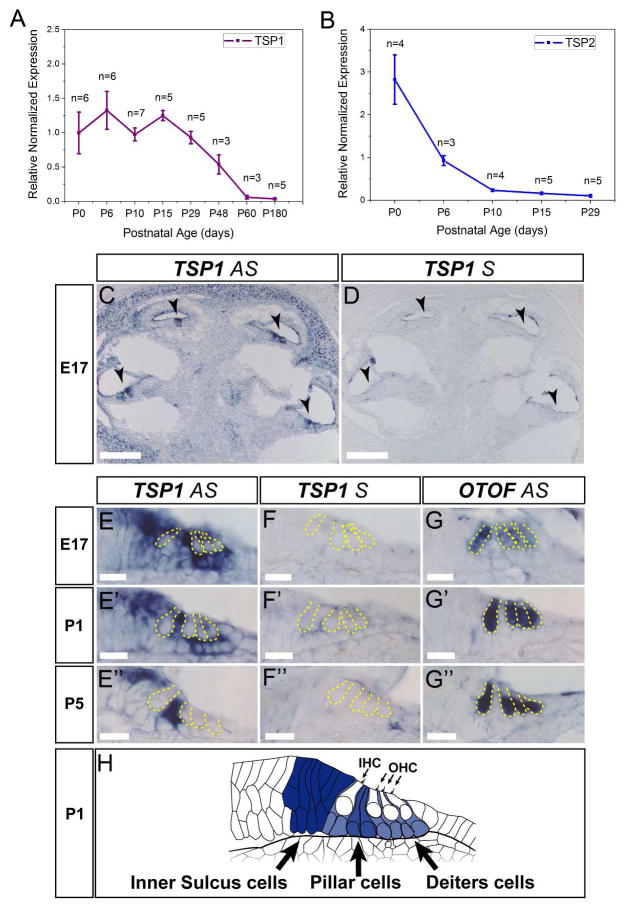
Expression of TSP1 and TSP2 and in the mouse cochlea. A and B, Quantitative RT-PCR was used to determine expression of TSP1 (A), TSP2 (B) genes in mouse cochlea at postnatal (P) day 0, 6, 10, 15, 29 for both genes, and additionally at P48, P60 and P120 for TSP1 gene. Data shown is the expression of the gene of interest relative to the internal standard, GAPDH. Results are expressed as mean ± standard error of the mean (SEM). C, D, In situ hybridization for TSP1 in cross-sections of E17 embryonic cochlea. Arrowheads indicate organ of Corti. E, Close view of the organ of Corti with antisense (AS) TSP1 probe (E) at different developmental ages starting from E17 (E) and followed by P1 (E′) and P5 (E″). F, Control sense (S) probe for TSP1 was included for all ages tested (F – F″) to confirm specificity. G, AS otoferlin (OTOF) probe was used to visualize inner and outer hair cells in the organ of Corti at E17 (G), P1 (G′) and P5 (G″). Yellow dashed line indicates borders of IHC and OHC on E – G. H, Schematic representation of the TSP1 expression at P1 with strong expression in inner sulcus cells, phalangeal, pillar and Deiter’s cells (expression pattern is shown as darker color for higher expression). AS – antisense probe, S – sense probe, P- postnatal day, IHC – inner hair cell, OHC – outer hair cell. Scale bar: C and D – 200 μm, E – G – 20 μm.

