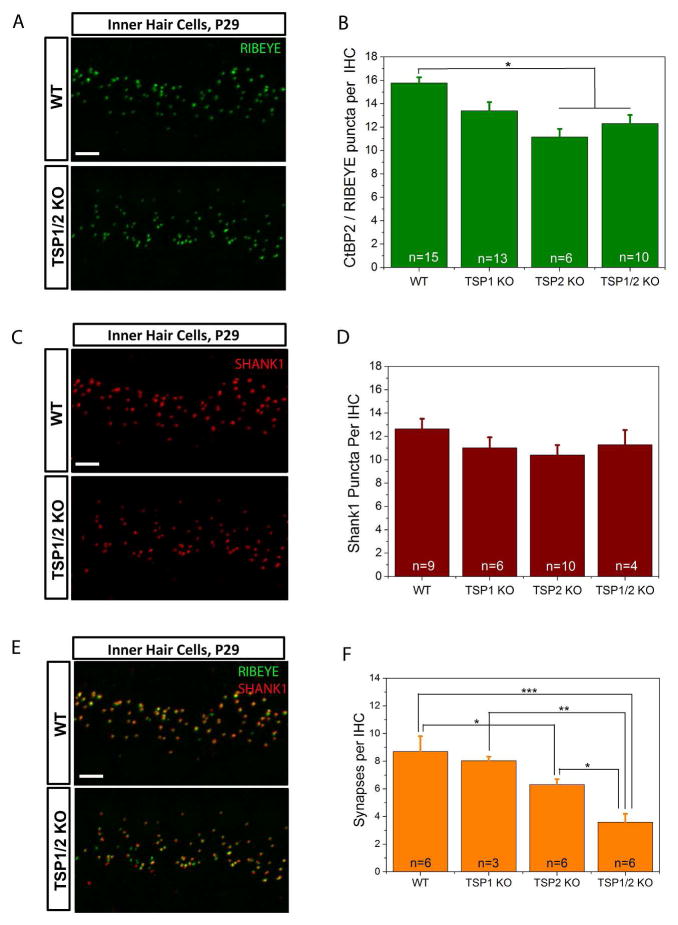
Figure 2.
Evaluation of synapse numbers in the TSP1, TSP2 and TSP1/2 mutants. A, C, and E, Immunolabeling of RIBEYE (A), SHANK1 (C) or both (E) at IHC in WT and TSP1/2 mutants at 16 kHz region in the cochlea. Scale bar is 10 μm. P values indicated are from Scheffe’s post hoc test following a one-way ANOVA. B, Synaptic ribbon counts at 16 kHz region for TSP1, TSP2, TSP1/2 KOs and WT animals. Significant differences were seen between WT and TSP2 KO (P = 0.002) and WT and TSP1/2 KO (P = 0.007). D, Quantification of the total number of postsynaptic marker SHANK1 showed no significant differences (P = 0.201) between WT and TSP mutants. F, Quantification of synapses. The average numbers of presynaptic RIBEYE that colocalized with postsynaptic SHANK1 per IHC were counted in WT and TSP mutant mice. A reduction in the number of synapses was observed in TSP1/2 KOs with respect to WT (P = 0.000), TSP1 KOs (P = 0.002) and TSP2 KOs (P = 0.015). Synapse numbers were reduced in TSP2 KOs with respect to WT (P = 0.035). Number of animals tested (n) per genotype and type of staining is indicated on the graphs. Results are expressed as mean ± SEM. Significant differences are indicated by * for P < 0.05, ** for P < 0.01 or *** for P < 0.001.

