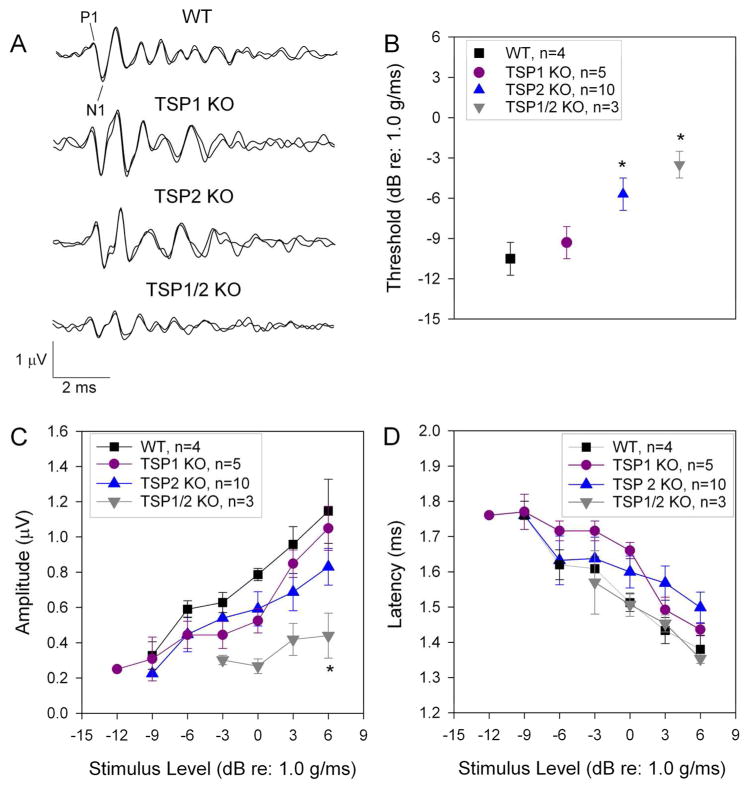
Figure 7.
Contribution of TSP1 and TSP2 to vestibular function. A, Representative VsEP waveforms collected at +6 dB (re: 1.0 g/ms) for the four genotypes tested. P1 - N1 represents the first response peak measured for latency and amplitude. A one-way ANOVA followed by post hoc test was used for statistical analysis. B, On average, VsEP thresholds were significantly elevated in TSP1/2 KO mice (downward triangle) compared to WT (square) (P = 0.010) and TSP1 KO (circle) mice (P = 0.023). TSP2 KO mice (upward triangle) also had VsEP thresholds significantly higher than WT mice (P = 0.020). C, VsEP wave I amplitudes were significantly reduced for TSP1/2 KO mice compared to WT (P = 0.011) and TSP1 KO mice (P = 0.014). D, VsEP wave I latencies were not significantly different across genotypes. Significant differences are indicated by * for P < 0.05, ** for P < 0.01 or *** for P < 0.001.

