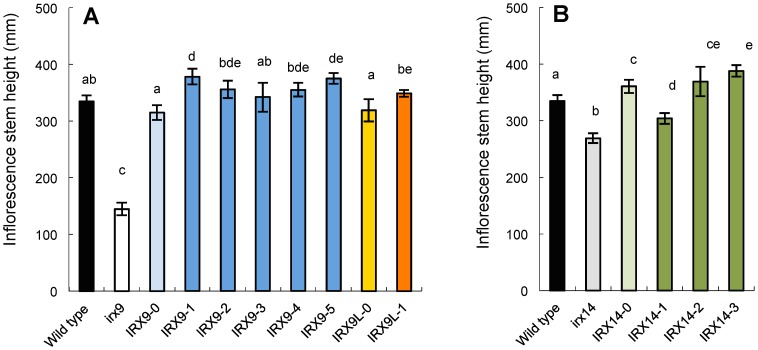
Figure 4. Stem height of 6-week-old mutant plants transformed with the different constructs.
The nomenclature for the constructs used to transform the irx9 and irx14 plants is explained in Table 1. The bars show average ± SD (n = 6). Averages that are not significantly different (ANOVA, Tukey's test, p>0.05) are indicated with the same letter.

