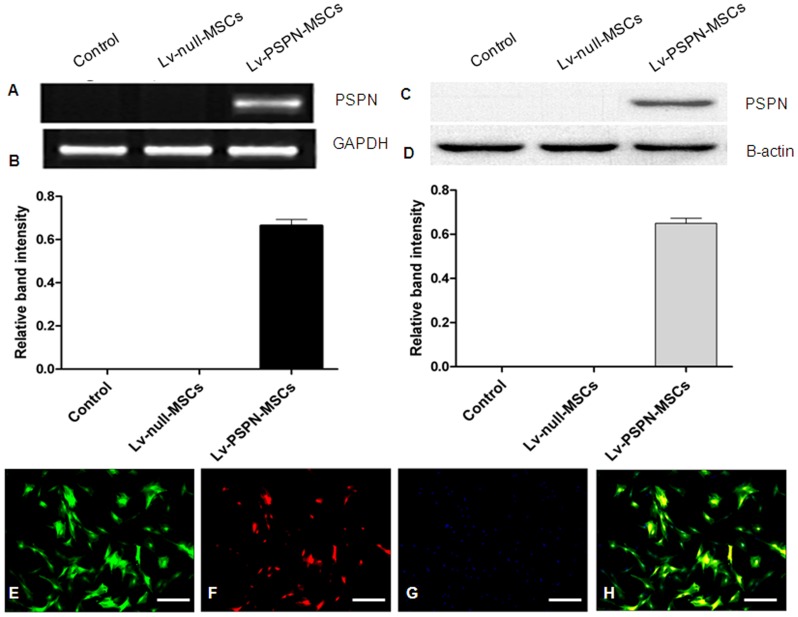
Figure 4. Expression of PSPN genes in transduced rMSCs detected by Western blots, RT-PCR and immunofluorescence.
(A) RT-PCR detection of PSPN expression in rMSCs. (B) The relative density of bands was calculated using GAPDH as a loading control. (C) Western blots analysis of cell extracts from rMSCs after transduction with Lv-PSPN. Equal amounts of cell extracts were used in all lanes. β-actin was used as a loading control. (D) Western blotting films from three independent experiments were scanned and the relative density of protein bands was calculated using β-actin as a loading control. At least three independent experiments were performed. Data are presented as means±SD. Immunofluorescence staining for PSPN (E–H). (E) EGFP-labeled rMSCs. (F) Expression of PSPN genes in transduced rMSCs. (G) Hoechst33258-stained nuclei. (H) Merged images. Scale bar = 200 µm.

