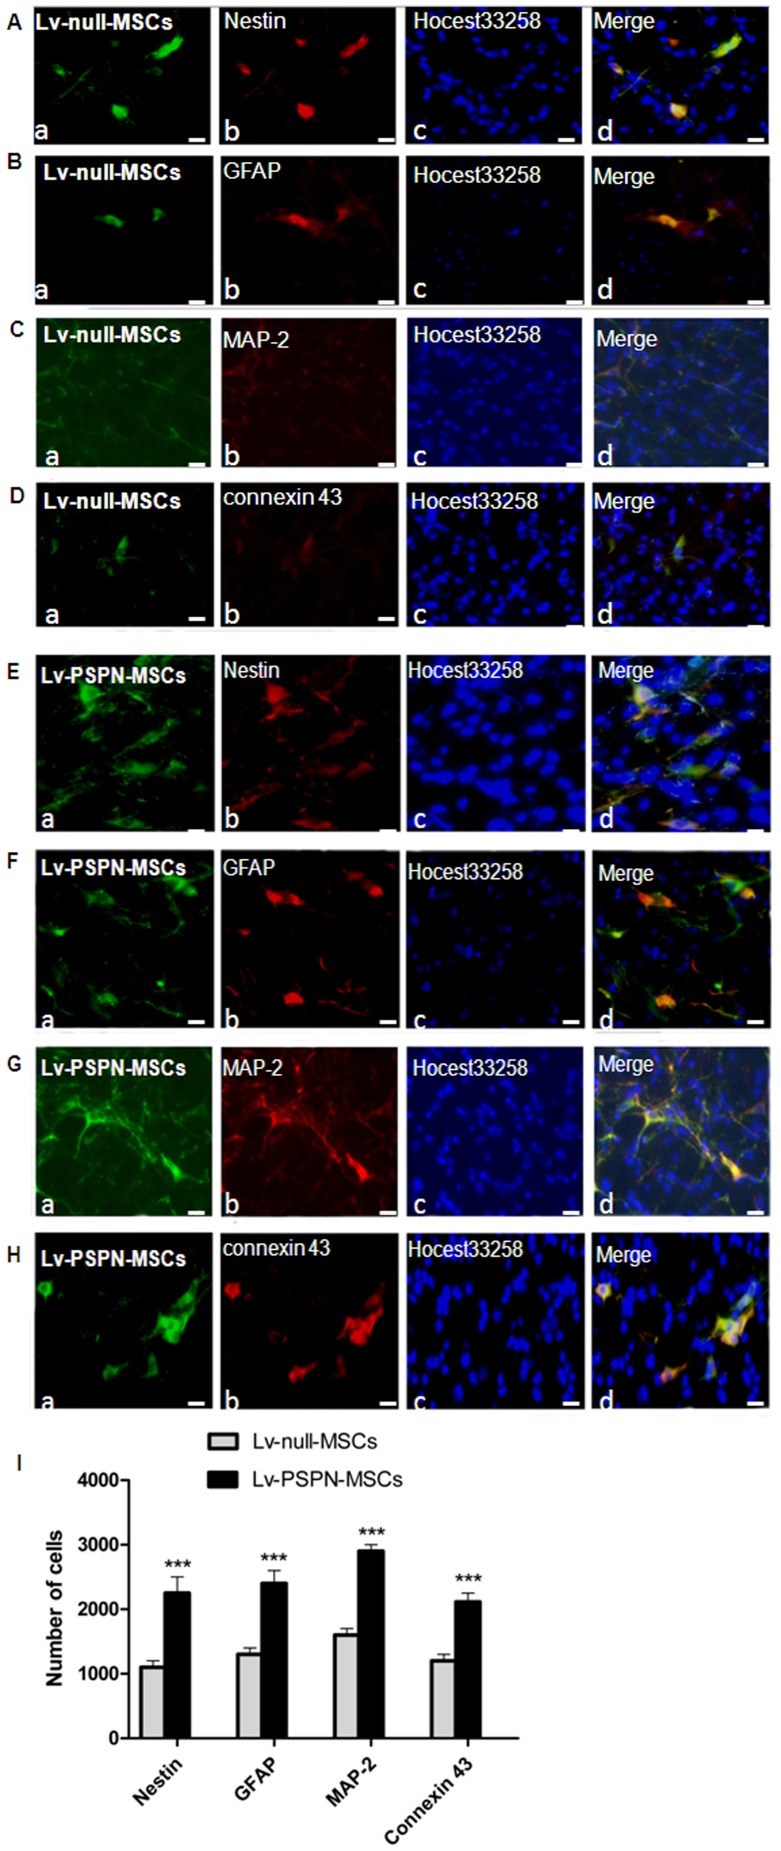
Figure 7. Immunofluorescence analysis of neural marker expression in EGFP-labeled rMSCs after settling in the striatum of PD rats.
Fluorescence microscopic analysis of EGFP-labeled rMSCs striatal sections in Lv-null-MSCs group and Lv-PSPN-MSCs group four weeks after cell transplantation. Transplanted Lv-null-MSCs (green) were immunostained against cell markers Nestin (A-b; red), GFAP (B-b; red), MAP-2(C-b; red), connexin 43(D-b; red). Corresponding merged images are shown accordingly (d). Images from the Lv-PSPN-MSCs group (E–H) are stained with the same cell markers as the Lv-null-MSCs group. (I) Quantitation of Nestin, GFAP, MAP-2, connexin 43-positive cells in the striatum from Lv-null-MSCs group and Lv-PSPN-MSCs group. Error bars represent SD, ***P<0.001. Scale bar = 200 µm.

