
Figure 7. Comparative evaluation of Ag5 and commercial ELISA kits.
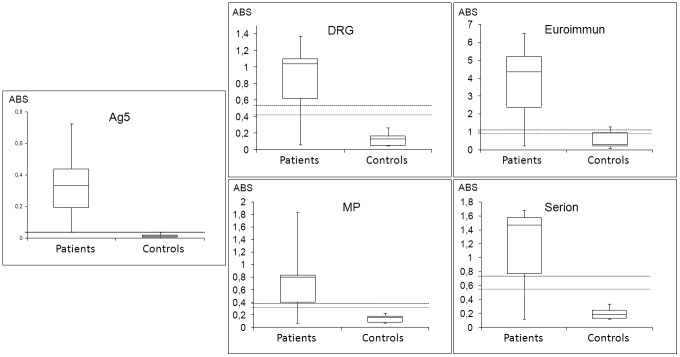
Boxplots summarizing the absorbance values obtained with the Ag5 preparation and commercial ELISA kits on CE patients and control subjects. Patient and control sera are plotted according to the clinical status. The dashed and dotted lines indicate the upper and lower cutoff values, respectively. ABS: absorbance at the wavelength required for each assay. Differences in absorbance between the patient and control groups were statistically significant for all the assays (P<0.001).