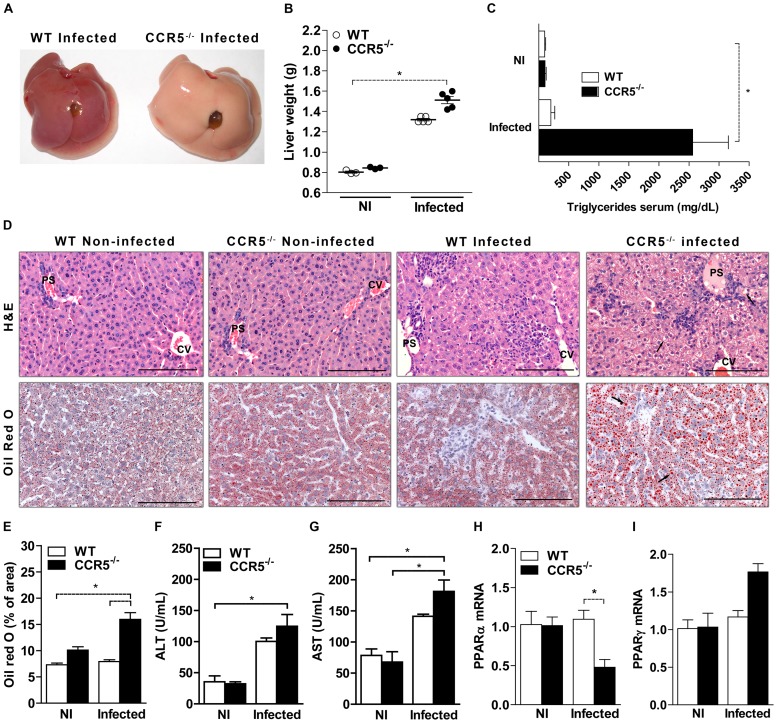
Figure 3. Lipid alterations and liver damage in CCR5-/- infected mice.
WT and CCR5-/- mice were infected with 5 cysts of T. gondii and at day 8 pi the liver was harvested, photographed (A), weighed (B) and formalin-fixed for Hematoxylin and Eosin (H&E) staining (D, upper pannel) or frozen in OCT medium for Oil Red O staining (D lower pannel) and analysis by light microscopy. Lipid quantification was performed using specific software and expressed as percentage of area (E). Blood was collected and processed to serum triglycerides quantification (C), alanine aminotransferase-ALT (F) and aspartate aminotransferase-AST (G). The liver was also harvested in Trizol reagent, homogenized and total RNA extracted. Expression of PPARα (H) and PPARγ (I) was determined by quantitative real time PCR (qPCR). The data represent the mean ± SEM of results from three to five mice per group and are representative of two independent experiments. * p<0.05 compared to WT mice. NI: non-infected. PS: portal space, CV: centrolobular veins. Arrows: hepatocyte vacuolization. Scale bar: 100 µm.

