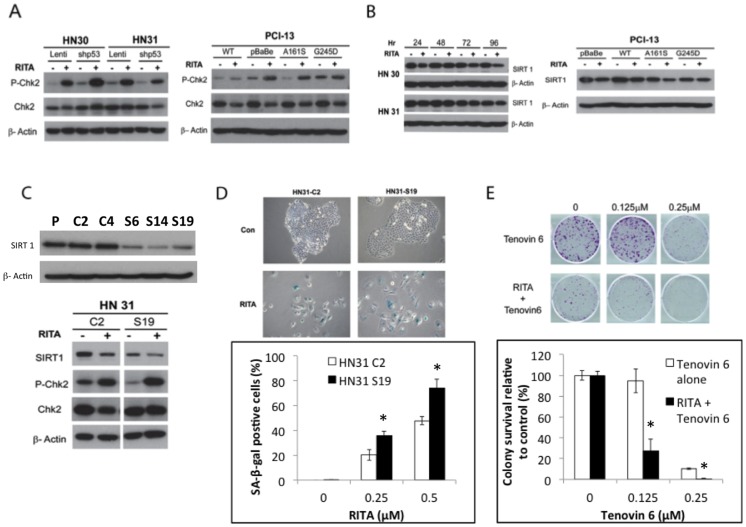
Figure 5. RITA leads to CHK2 phosphorylation and SIRT1 inhibition in head and neck cancer cell lines.
(A) HN30 or HN31 cells transfected with lentiviral control or short-hairpin RNA, p53-stable-knockdown constructs were treated with 1 µM RITA 1 for 72 hours, after which protein lysates were prepared and levels of total and phosphorylated Chk2 assessed by immunoblotting. Right: PCI-13 cells transfected with the indicated constructs were treated with 2.5 µM RITA for various periods, after which protein lysates were prepared and levels of total and phosphorylated Chk2 were assessed. (B) HN30, HN31, and PCI-13 cells with the indicated p53 constructs were treated with RITA for the indicated periods, and lysates were assessed for SIRT1 protein expression by western blotting. β-actin was used as an internal loading control. (C) HN31 cells stably transduced with lentiviral control vectors (C) or SIRT1 shRNA (S) were initially assayed for inhibition of SIRT-1 expression. Representative clones were then treated with 2.5 µM RITA for 72 hours, after which the indicated proteins were extracted and analyzed by western blotting. (D) HN31 cells stably transduced with lentiviral control vectors (C2) or SIRT1 shRNA (S19) were seeded in 6-well tissue culture plates and treated with the indicated concentrations of RITA for 5 days, after which cells were fixed and stained for senescence-associated -β-galactosidase (SA-β-gal) activity. Representative images from three experiments with similar results are shown. * - indicates significantly increased compared to control vector at the indicated dose (p<0.05). (E) HN31 cells were seeded on 6-well plates and treated with RITA (0.25 M) with or without Tenovin 6 (0.125 or 0.25 µM) for 10 days, after which colonies were fixed, stained, and quantified. * - indicates significantly decreased compared to Tenovin 6 alone group at the indicated dose. Data are normalized to either vehicle-only or RITA treatment conditions. Representative images from three experiments with similar results are shown. Data are expressed as means ± S.E from three experiments.

