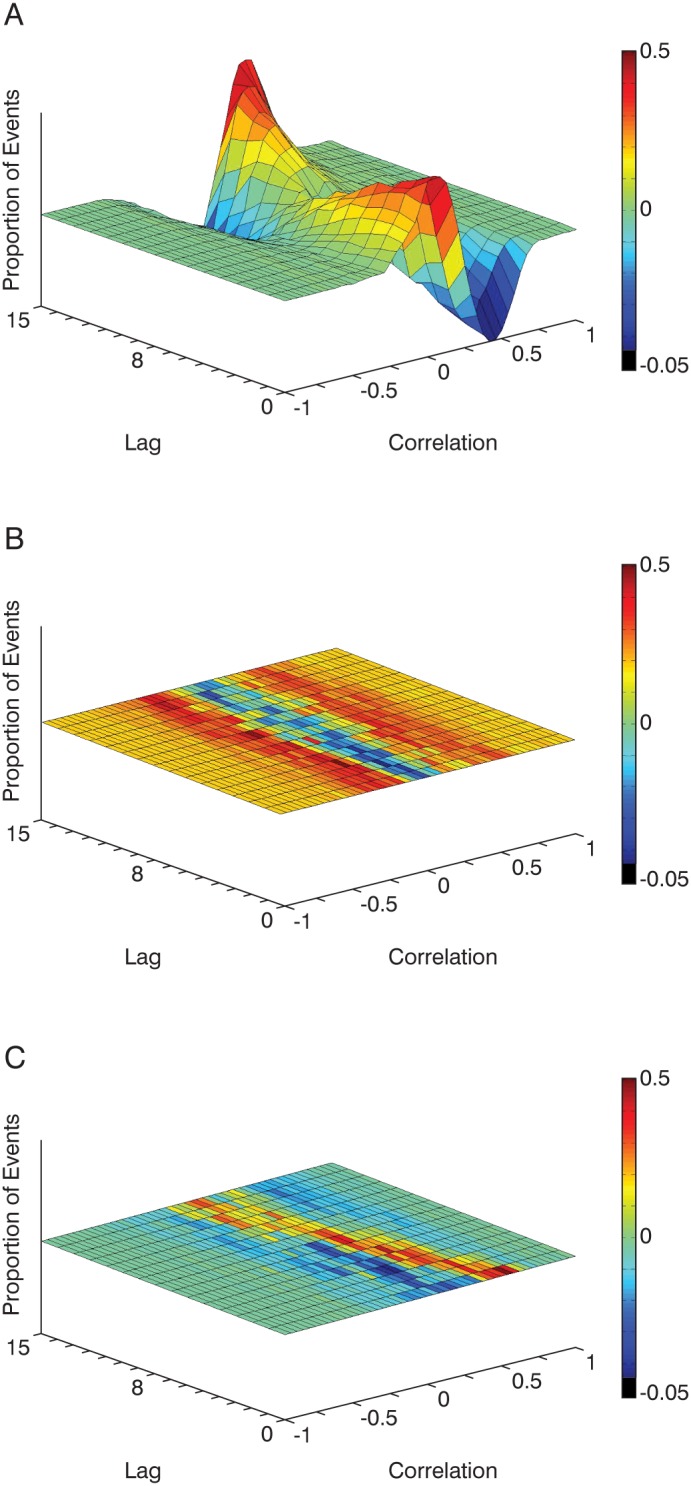
Figure 3. Three-dimensional average correlation difference distributions for A) friends-strangers, B) random-pair subtractions and C) real-pair random subtractions.

Redder colors indicate higher correlation differences along the x-axis with height indicating frequency of events. Lag counts (in frames) indicate 16 temporal points between 0 and 0.5 s where average correlation was computed. Greater positive peaks indicate more correlated events for friends in comparison to strangers.
