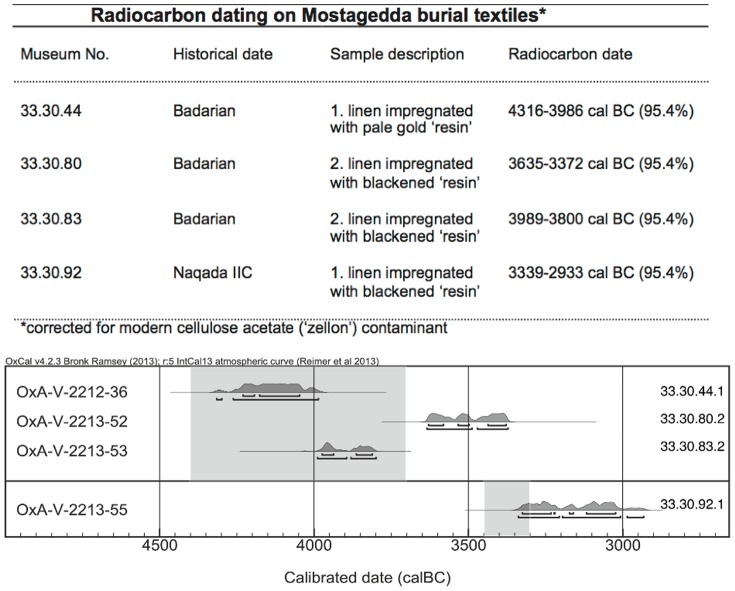
Figure 1. Calibrated ages for the corrected textile dated samples.
The table displays the data corresponding to these probability distributions at 68.2% and 95.4% probability. The shaded areas denote the accepted archaeological age range for the Badarian (top of picture) and Naqada IIC period (bottom) respectively. (Figure generated using OxCal 4.1 (Bronk Ramsey 2009)).

