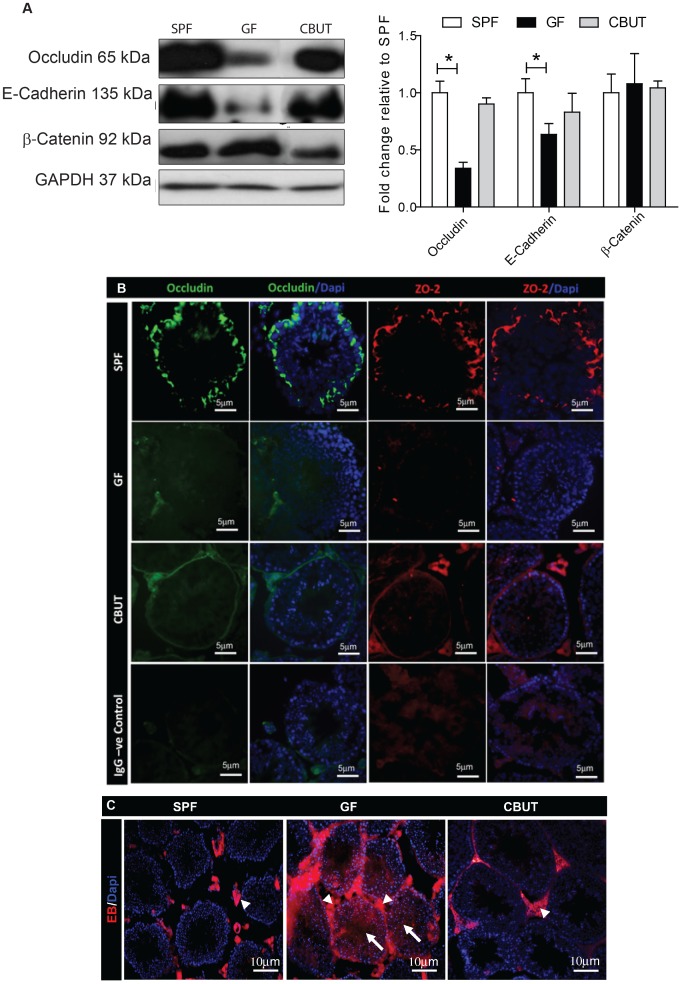
Figure 4. Expression of tight junction proteins and changes in the permeability of the BTB of 8–10 weeks old SPF, GF and CBUT mice.
(A) Representative Western blots for occludin, E-cadherin and β-catenin, and quantification of these blots relative to the levels of GAPDH (means ± SEM., n = 3–6 *P<0.05) compared to the values for SPF mice. (B) Immunofluorescent staining for occludin (green) and ZO-2 (red) individually and merged with nuclear staining (DAPI – blue). The scale bar represents 5 µm. (C) Evans blue (EB – red) and nuclear staining (DAPI – blue) showing interstitial cells (arrowheads) and seminiferous tubules (arrows). Scale bar represents 10 µm.

