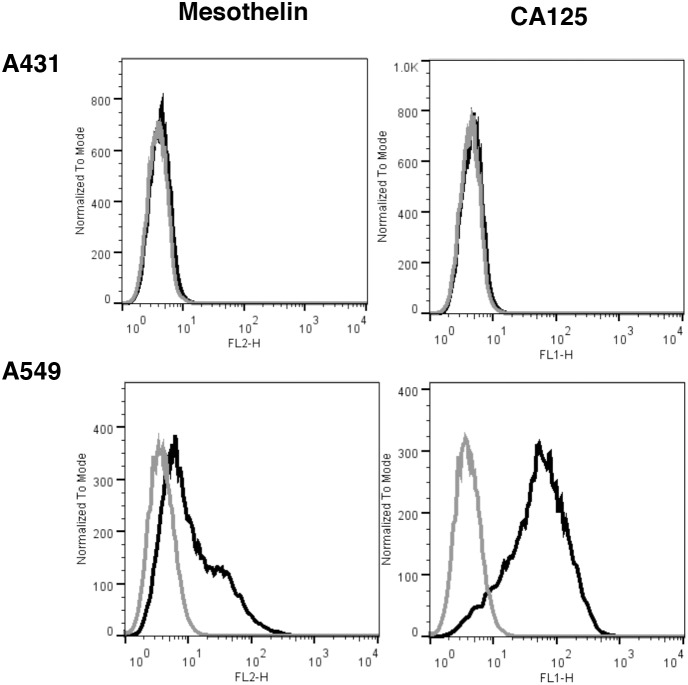
Figure 3. FACS analysis for mesothelin and CA125 expressions in A431 and A549 cell lines.
Cells were incubated with the indicated primary antibodies or isotope control antibodies, and appropriate secondary antibody (goat anti-mouse IgG, R-PE or goat anti-mouse, FITC). Results are shown as histogram plots for binding of primary antibody (black trace) or isotype control (gray trace). A431 cells are negative for both MSLN and CA125. A549 cells show low mesothelin expression (3.5×10³ sites/cell) but highly express CA125.

